prometheus+grafana监控设置
环境
prometheus+grafana 192.168.210.99
agent01(被监控端) 192.168.210.100
agent02(被监控端) 192.168.210.101
一、介绍Prometheus
Prometheus(普罗米修斯)是一套开源的监控&报警&时间序列数据库的组合,起始是由SoundCloud公司开发的。随着发展,越来越多公司和组织接受采用Prometheus,社会也十分活跃,他们便将它独立成开源项目,并且有公司来运作。Google SRE的书内也曾提到跟他们BorgMon监控系统相似的实现是Prometheus。现在最常见的Kubernetes容器管理系统中,通常会搭配Prometheus进行监控。
Prometheus基本原理是通过HTTP协议周期性抓取被监控组件的状态,这样做的好处是任意组件只要提供HTTP接口就可以接入监控系统,不需要任何SDK或者其他的集成过程。这样做非常适合虚拟化环境比如VM或者Docker 。
Prometheus应该是为数不多的适合Docker、Mesos、Kubernetes环境的监控系统之一。
输出被监控组件信息的HTTP接口被叫做exporter 。目前互联网公司常用的组件大部分都有exporter可以直接使用,比如Varnish、Haproxy、Nginx、MySQL、Linux 系统信息 (包括磁盘、内存、CPU、网络等等),具体支持的源看:https://github.com/prometheus。
与其他监控系统相比,Prometheus的主要特点是:
一个多维数据模型(时间序列由指标名称定义和设置键/值尺寸)。
非常高效的存储,平均一个采样数据占~3.5bytes左右,320万的时间序列,每30秒采样,保持60天,消耗磁盘大概228G。
一种灵活的查询语言。
不依赖分布式存储,单个服务器节点。
时间集合通过HTTP上的PULL模型进行。
通过中间网关支持推送时间。
通过服务发现或静态配置发现目标。
多种模式的图形和仪表板支持。
二、Prometheus架构概览
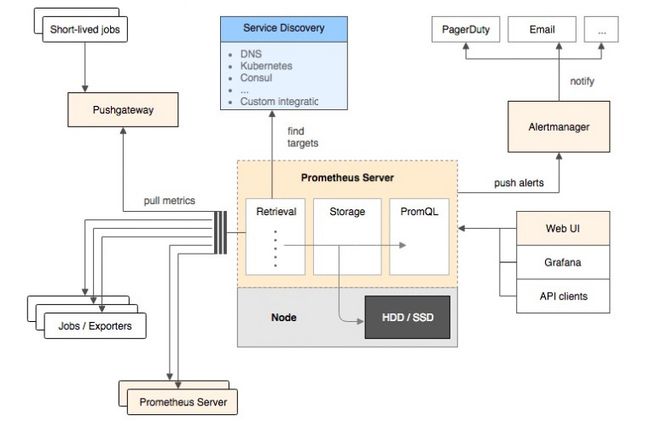
该图说明了普罗米修斯(Prometheus)及其一些生态系统组件的整体架构:
它的服务过程是这样的Prometheus daemon负责定时去目标上抓取metrics(指标) 数据,每个抓取目标需要暴露一个http服务的接口给它定时抓取。
Prometheus:支持通过配置文件、文本文件、zookeeper、Consul、DNS SRV lookup等方式指定抓取目标。支持很多方式的图表可视化,例如十分精美的Grafana,自带的Promdash,以及自身提供的模版引擎等等,还提供HTTP API的查询方式,自定义所需要的输出。
Alertmanager:是独立于Prometheus的一个组件,可以支持Prometheus的查询语句,提供十分灵活的报警方式。
PushGateway:这个组件是支持Client主动推送metrics到PushGateway,而Prometheus只是定时去Gateway上抓取数据。
如果有使用过statsd的用户,则会觉得这十分相似,只是statsd是直接发送给服务器端,而Prometheus主要还是靠进程主动去抓取。
大多数Prometheus组件都是用Go编写的,它们可以轻松地构建和部署为静态二进制文件。访问prometheus.io以获取完整的文档,示例和指南。
三、Prometheus的数据模型
Prometheus从根本上所有的存储都是按时间序列去实现的,相同的metrics(指标名称) 和label(一个或多个标签) 组成一条时间序列,不同的label表示不同的时间序列。为了支持一些查询,有时还会临时产生一些时间序列存储。
metrics name&label指标名称和标签
每条时间序列是由唯一的”指标名称”和一组”标签(key=value)”的形式组成。
指标名称:一般是给监测对像起一名字,例如http_requests_total这样,它有一些命名规则,可以包字母数字之类的的。通常是以应用名称开头监测对像数值类型单位这样。例如:push_total、userlogin_mysql_duration_seconds、app_memory_usage_bytes。
标签:就是对一条时间序列不同维度的识别了,例如一个http请求用的是POST还是GET,它的endpoint是什么,这时候就要用标签去标记了。最终形成的标识便是这样了:http_requests_total{method=”POST”,endpoint=”/api/tracks”}。
记住,针对http_requests_total这个metrics name无论是增加标签还是删除标签都会形成一条新的时间序列。
查询语句就可以跟据上面标签的组合来查询聚合结果了。
如果以传统数据库的理解来看这条语句,则可以考虑http_requests_total是表名,标签是字段,而timestamp是主键,还有一个float64字段是值了。(Prometheus里面所有值都是按float64存储)。
四、Prometheus四种数据类型
Counter
Counter用于累计值,例如记录请求次数、任务完成数、错误发生次数。一直增加,不会减少。重启进程后,会被重置。
例如:http_response_total{method=”GET”,endpoint=”/api/tracks”} 100,10秒后抓取http_response_total{method=”GET”,endpoint=”/api/tracks”} 100。
Gauge
Gauge常规数值,例如 温度变化、内存使用变化。可变大,可变小。重启进程后,会被重置。
例如: memory_usage_bytes{host=”master-01″} 100 < 抓取值、memory_usage_bytes{host=”master-01″} 30、memory_usage_bytes{host=”master-01″} 50、memory_usage_bytes{host=”master-01″} 80 < 抓取值。
Histogram
Histogram(直方图)可以理解为柱状图的意思,常用于跟踪事件发生的规模,例如:请求耗时、响应大小。它特别之处是可以对记录的内容进行分组,提供count和sum全部值的功能。
例如:{小于10=5次,小于20=1次,小于30=2次},count=7次,sum=7次的求和值。
Summary
Summary和Histogram十分相似,常用于跟踪事件发生的规模,例如:请求耗时、响应大小。同样提供 count 和 sum 全部值的功能。
例如:count=7次,sum=7次的值求值。
它提供一个quantiles的功能,可以按%比划分跟踪的结果。例如:quantile取值0.95,表示取采样值里面的95%数据。
五、安装运行Prometheus(二进制版)
下面介绍如何使用Prometheus和Grafana对MySQL服务器性能进行监控。
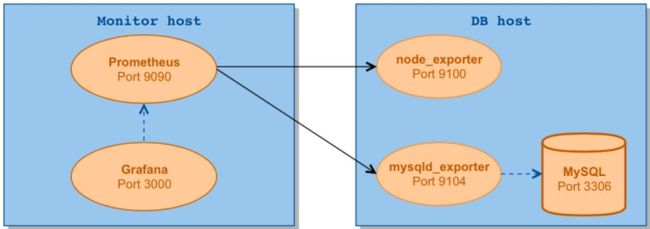
我们用到了以下两个exporter:
node_exporter – 用于机器系统数据收集
mysqld_exporter – 用于MySQL服务器数据收集
Grafana是一个开源的功能丰富的数据可视化平台,通常用于时序数据的可视化。它内置了以下数据源的支持:
下面是我们安装时用到的架构图:
首先安装GO
$ yum install go
$ go version
go version go1.9.4 linux/amd64
下载安装Prometheus(https://prometheus.io/download/)
$ wget https://github.com/prometheus/prometheus/releases/download/v2.3.0/prometheus-2.3.0.linux-amd64.tar.gz
$ tar zxvf prometheus-2.3.0.linux-amd64.tar.gz -C /usr/local/
$ ln -sv /usr/local/prometheus-2.3.0.linux-amd64/ /usr/local/prometheus
$ cd /usr/local/prometheus
修改Prometheus配置文件prometheus.yml (替换你要监控的IP地址):
- job_name: 'prometheus'

    # metrics_path defaults to '/metrics'
    # scheme defaults to 'http'.

    static_configs:
    - targets: ['localhost:9090']
      labels:
          instance: prometheus
  - job_name: linux
    static_configs:
      - targets: ['192.168.210.100:9100','192.168.210.101:9100']
        labels:
          instance: db1

  - job_name: mysql
    static_configs:
      - targets: ['192.168.210.101:9104']
        labels:
          instance: db1
192.168.210.101是我们数据库主机的IP,端口则是对应的exporter的监听端口。
启动Prometheus
nohup ./prometheus --config.file=prometheus.yml &
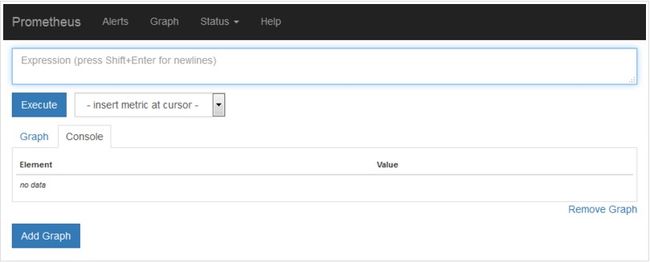
Prometheus内置了一个web界面,我们可通过http://monitor_host:9090进行访问:
在Status->Targets页面下,我们可以看到我们配置的两个Target,它们的State为DOWN。
下一步我们需要安装并运行exporter,下载exporters并解压到被监控端服务器:
$ wget https://github.com/prometheus/node_exporter/releases/download/v0.14.0/node_exporter-0.14.0.linux-amd64.tar.gz
$ wget https://github.com/prometheus/mysqld_exporter/releases/download/v0.10.0/mysqld_exporter-0.10.0.linux-amd64.tar.gz
被监控安装GO环境
$ yum install go
$ go version
go version go1.9.4 linux/amd64
安装运行node_exporter
$ tar xvf node_exporter-0.14.0.linux-amd64.tar.gz -C /usr/local/
$ nohup /usr/local/node_exporter-0.14.0.linux-amd64/node_exporter &
安装运行mysqld_exporter
mysqld_exporter需要连接到Mysql,所以需要Mysql的权限,我们先为它创建用户并赋予所需的权限.
mysql> GRANT REPLICATION CLIENT,PROCESS ON *.* TO 'mysql_monitor'@'localhost' identified by 'mysql_monitor';
mysql> GRANT SELECT ON *.* TO 'mysql_monitor'@'localhost';
创建.my.cnf文件并运行mysqld_exporter:
$ cat /usr/local/mysqld_exporter-0.10.0.linux-amd64/.my.cnf
[client]
user=mysql_monitor
password=mysql_monitor

$ tar xvf mysqld_exporter-0.10.0.linux-amd64.tar.gz -C /usr/local/
$ nohup /usr/local/mysqld_exporter-0.10.0.linux-amd64/mysqld_exporter -config.my-cnf="/usr/local/mysqld_exporter-0.10.0.linux-amd64/.my.cnf" &
我们再次回到Status->Targets页面,可以看到两个Target的状态已经变成UP了:
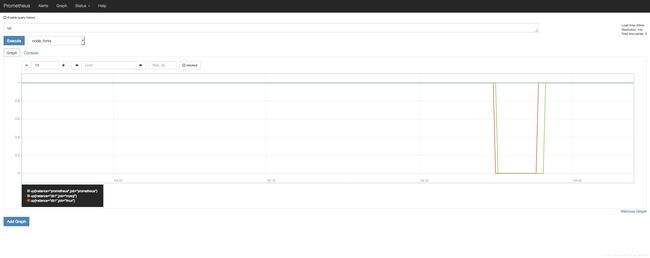
接下来就可以看图形了
注意:prometheus里面的时区是GMT,图形横轴显示的时间与后面的grafana显示时间不同,我们用的主机时区是CST,大家可以自己了解这个时区间的关系
Prometheus自带的图形并不够强大,于是我们可以使用Grafana作为Prometheus的Dashboard。
六、安装运行Grafana
Grafana安装配置介绍
$ wget https://s3-us-west-2.amazonaws.com/grafana-releases/release/grafana-5.0.1-1.x86_64.rpm
$ sudo yum localinstall grafana-5.0.1-1.x86_64.rpm
编辑配置文件/etc/grafana/grafana.ini,修改dashboards.json段落下两个参数的值:
[dashboards.json]
enabled = true
path = /var/lib/grafana/dashboards
安装仪表盘(Percona提供)
$ git clone https://github.com/percona/grafana-dashboards.git
$ cp -r grafana-dashboards/dashboards /var/lib/grafana
运行以下命令为Grafana打个补丁,不然图表不能正常显示:
$ sed -i 's/expr=\(.\)\.replace(\(.\)\.expr,\(.\)\.scopedVars\(.*\)var \(.\)=\(.\)\.interval/expr=\1.replace(\2.expr,\3.scopedVars\4var \5=\1.replace(\6.interval, \3.scopedVars)/' /usr/share/grafana/public/app/plugins/datasource/prometheus/datasource.js
$ sed -i 's/,range_input/.replace(\/"{\/g,"\\"").replace(\/}"\/g,"\\""),range_input/; s/step_input:""/step_input:this.target.step/' /usr/share/grafana/public/app/plugins/datasource/prometheus/query_ctrl.js
最后我们运行Grafana服务
$ systemctl daemon-reload
$ systemctl start grafana-server
$ systemctl status grafana-server
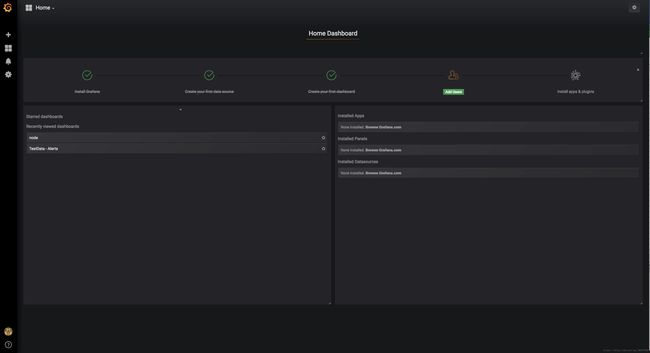
我们可通过http://monitor_host:3000访问Grafana网页界面(默认登陆帐号/密码为admin/admin):
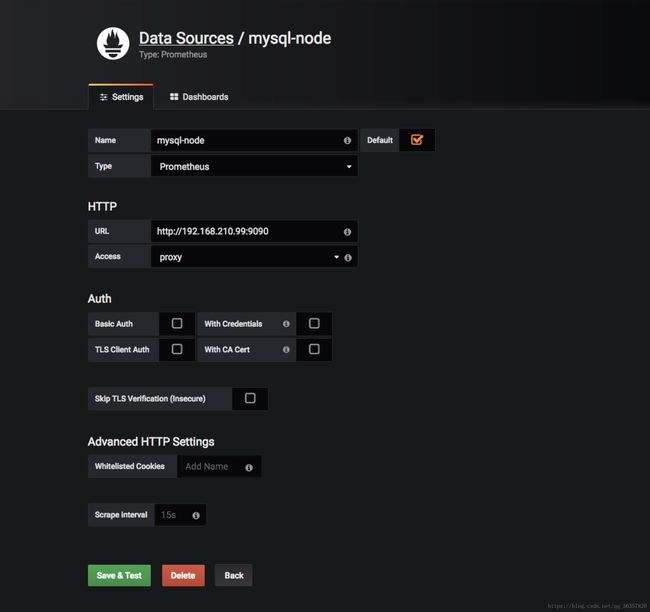
然后我们到Data Sources页面添加数据源:
七、设置grafana告警
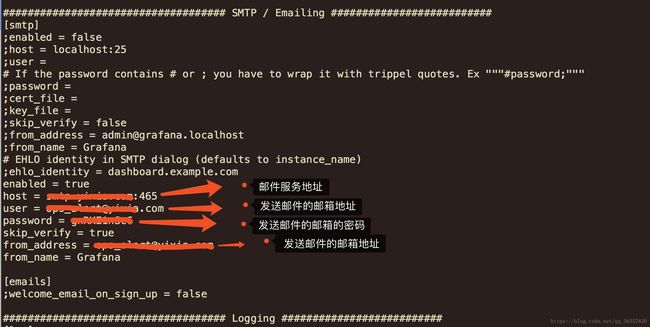
首先配置邮件服务
yum install -y sendmail
vi /etc/grafana/grafana.ini (配置文件添加如下)
重启grafana
systemctl restart grafana-server
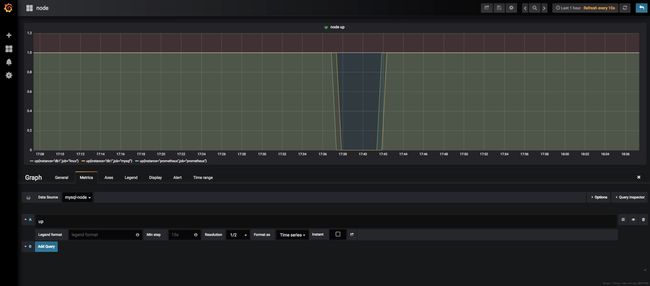
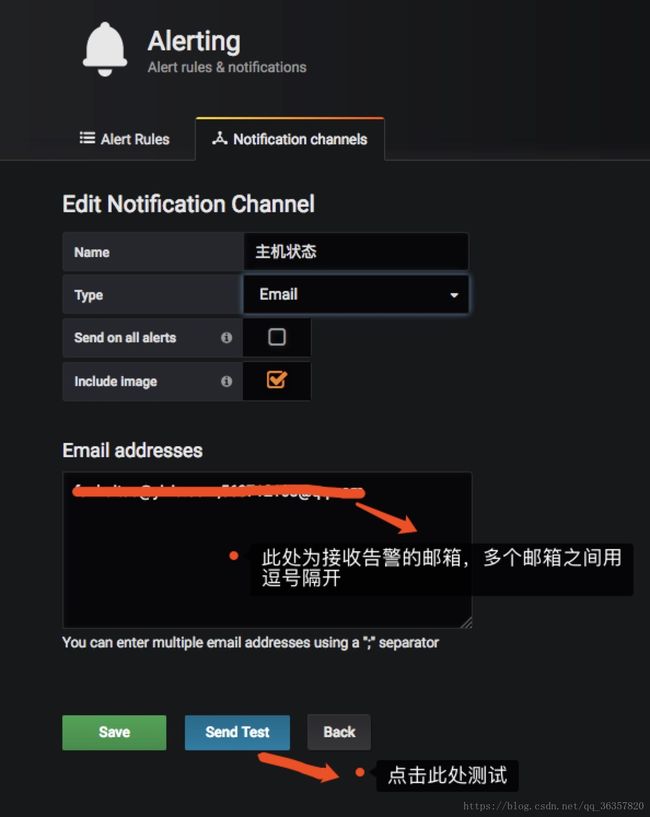
在grafana的web界面添加接收告警的邮箱地址
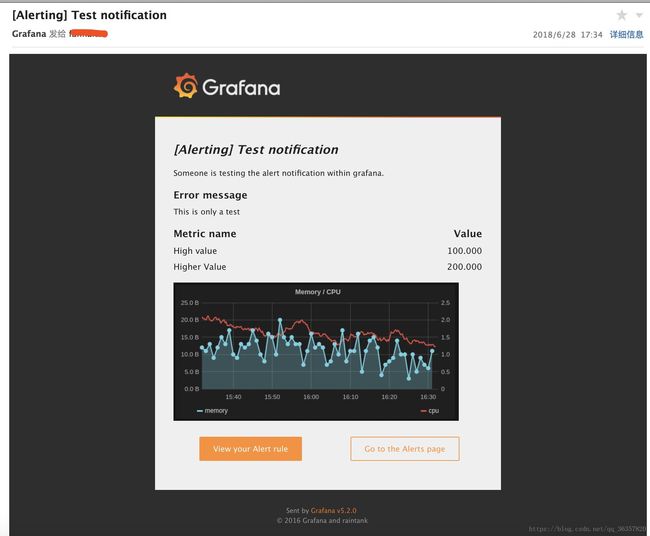
如果发送成功,右上角会有提示
八、prometheus告警设置
要实现prometheus的告警,需要通过altermanager这个组件;在prometheus服务端写告警规则,在altermanage组件配置邮箱;
1、prometheus告警规则写法,以下是例子
groups:
    - name: base-monitor-rule
      rules:
      - alert: NodeCpuUsage
        expr: (100 - (avg by (instance) (rate(node_cpu{job=~".*",mode="idle"}[2m])) * 100)) > 99
        for: 15m
        labels:
          service_name: test
          level: warning
        annotations:
          description: "{{$labels.instance}}: CPU usage is above 99% (current value is: {{ $value }}"
      - alert: NodeMemUsage
        expr: avg by  (instance) ((1- (node_memory_MemFree{} + node_memory_Buffers{} + node_memory_Cached{})/node_memory_MemTotal{}) * 100) > 90
        for: 15m
        labels:
          service_name: test
          level: warning
        annotations:
          description: "{{$labels.instance}}: MEM usage is above 90% (current value is: {{ $value }}"
      - alert: NodeDiskUsage
        expr: (1 - node_filesystem_free{fstype!="rootfs",mountpoint!="",mountpoint!~"/(run|var|sys|dev).*"} / node_filesystem_size) * 100 > 80
        for: 2m
        labels:
          service_name: test
          level: warning
        annotations:
          description: "{{$labels.instance}}: Disk usage is above 80% (current value is: {{ $value }}"
      - alert: NodeFDUsage
        expr: avg by (instance) (node_filefd_allocated{} / node_filefd_maximum{}) * 100 > 80
        for: 2m
        labels:
          service_name: test
          level: warning
        annotations:
          description: "{{$labels.instance}}: File Descriptor usage is above 80% (current value is: {{ $value }}"
      - alert: NodeLoad15
        expr: avg by (instance) (node_load15{}) > 100
        for: 2m
        labels:
          service_name: test
          level: warning
        annotations:
          description: "{{$labels.instance}}: Load15 is above 100 (current value is: {{ $value }}"
      - alert: NodeAgentStatus
        expr: avg by (instance) (up{}) == 0
        for: 2m
        labels:
          service_name: test
          level: warning
        annotations:
          description: "{{$labels.instance}}: Node Agent is down (current value is: {{ $value }}"
      - alert: NodeProcsBlocked
        expr: avg by (instance) (node_procs_blocked{}) > 100
        for: 2m
        labels:
          service_name: test
          level: warning
        annotations:
          description: "{{$labels.instance}}: Node Blocked Procs detected!(current value is: {{ $value }}"
      - alert: NodeTransmitRate
        expr:  avg by (instance) (floor(irate(node_network_transmit_bytes{device="eth0"}[2m]) / 1024 / 1024)) > 100
        for: 2m
        labels:
          service_name: test
          level: warning
        annotations:
          description: "{{$labels.instance}}: Node Transmit Rate  is above 100MB/s (current value is: {{ $value }}"
      - alert: NodeReceiveRate
        expr:  avg by (instance) (floor(irate(node_network_receive_bytes{device="eth0"}[2m]) / 1024 / 1024)) > 100
        for: 2m
        labels:
          service_name: test
          level: warning
        annotations:
          description: "{{$labels.instance}}: Node Receive Rate  is above 100MB/s (current value is: {{ $value }}"
      - alert: NodeDiskReadRate
        expr: avg by (instance) (floor(irate(node_disk_bytes_read{}[2m]) / 1024 / 1024)) > 50
        for: 2m
        labels:
          service_name: test
          level: warning
        annotations:
          description: "{{$labels.instance}}: Node Disk Read Rate is above 50MB/s (current value is: {{ $value }}"
      - alert: NodeDiskWriteRate
        expr: avg by (instance) (floor(irate(node_disk_bytes_written{}[2m]) / 1024 / 1024)) > 50
        for: 2m
        labels:
          service_name: test
          level: warning
        annotations:
          description: "{{$labels.instance}}: Node Disk Write Rate is above 50MB/s (current value is: {{ $value }}"
操作如下:
[root@mp-sre-fanhaitao prometheus-2.3.1.linux-amd64]# pwd
/usr/local/prometheus-2.3.1.linux-amd64
[root@mp-sre-fanhaitao prometheus-2.3.1.linux-amd64]# vi prometheus.yml
# Alertmanager configuration
alerting:
  alertmanagers:
  - static_configs:
    - targets:
       - 192.168.210.100:9093     #此处我没有将altermanager和prometheus装在一台机器上

rule_files:
  - rules/haitao.rules    #告警规则文件,自定义一个
告警规则文件
[root@mp-sre-fanhaitao rules]# pwd
/usr/local/prometheus-2.3.1.linux-amd64/rules
[root@mp-sre-fanhaitao rules]# vi haitao.rules
groups:
    - name: base-monitor-rule
      rules:
      - alert: NodeDiskUsage
        expr: ceil(node_filesystem_avail_bytes{mountpoint="/", device="/dev/vda1"} /1024 / 1024 / 1024) > 92  #此处的语法是prometheus的重点,需要自己学习
        for: 1m
        annotations:
          description: "{{$labels.instance}}: Node Disk Usage is above 90GB (current value is: {{ $value }}"
2、altermanager设置邮箱
[root@mp-sre-fanhaitao alertmanager-0.15.0.linux-amd64]# pwd
/usr/local/alertmanager-0.15.0.linux-amd64
[root@mp-sre-fanhaitao alertmanager-0.15.0.linux-amd64]# vi alertmanager.yml
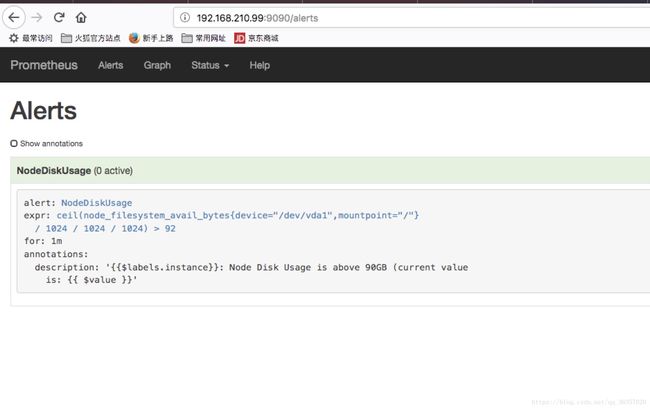
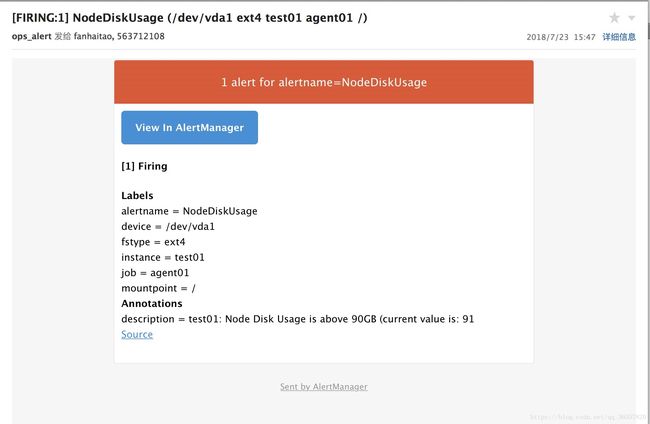
定义好告警规则和设置邮箱后,可以在prometheus的web端看到定义好的规则,如下
参考
http://www.ywnds.com/?p=9656
