声明 是阅读标哥技术博客的做的个人笔记
1、常用的调试命令 p、po、、print、call
对比一下四个命令的区别
p         -- ('expression --')  Evaluate an expression (ObjC++ or Swift) in
               the current program context, using user defined variables and
               variables currently in scope.
po        -- ('expression -O  -- ')  Evaluate an expression (ObjC++ or Swift)
               in the current program context, using user defined variables and
               variables currently in scope.
print     -- ('expression --')  Evaluate an expression (ObjC++ or Swift) in
               the current program context, using user defined variables and
               variables currently in scope.
call      -- ('expression --')  Evaluate an expression (ObjC++ or Swift) in
               the current program context, using user defined variables and
               variables currently in scope.
从官方描述来看 p、print、call是一样 但是po就很不一样了,输入一样但是输出不一样,po的输出的是具体对象的内容。
按照特定的格式打印,如下:
(lldb) p/s blogName
(__NSCFConstantString *) $9 = @"me的技术博客"
(lldb) p/x blogName
(__NSCFConstantString *) $10 = 0x000000010921c0a8 @"me的技术博客"
(lldb) p/t blogName
(__NSCFConstantString *) $11 = 0b0000000000000000000000000000000100001001001000011100000010101000 @"me的技术博客"
(lldb) p/a blogName
(__NSCFConstantString *) $12 = 0x000000010921c0a8 @ @"me的技术博客"
2、lldb生命变量
在调试中,可以用e命令定义变量,方便在调试中使用
例子如下
(lldb) e NSString *$str = @"http://www.baidu.com"
(lldb) po $str
http://www.baidu.com

(lldb) e int $count = 10
(lldb) p $count
(int) $count = 10
(lldb) e NSArray *itemArray = @[@"Test", @"Demo", @"-------"]
(lldb) po $count
10
使用e声明了$str变量,然后就可以使用了。再通过p命令打印出来的都是用$开头的变量
3、调用变量API
在我们断点某处时,打印上下环境中的某个变量调用函数的输出结果
(lldb) po [blogName uppercaseString]
me的技术博客

(lldb) po [blogName substringFromIndex:2]
的技术博客
4、强转返回值类型
和我们在coding的时候的使用强转的方法是一样的
5、断点
我们可以在开始调试的时候 通过b命令
(lldb) b   33
Breakpoint 9: where = OCLLDBDebugDemo`-[ViewController onButtonClicked:] + 53 at ViewController.m:33, address = 0x000000010921a6d5
也可以这样加断点
(lldb) b  -[ViewController onButtonClicked:]
Breakpoint 4: where = OCLLDBDebugDemo`-[ViewController onButtonClicked:] + 53 at ViewController.m:33, address = 0x000000010921a6d5
不过自认为还是b加行号
6、设置触发条件
先上图
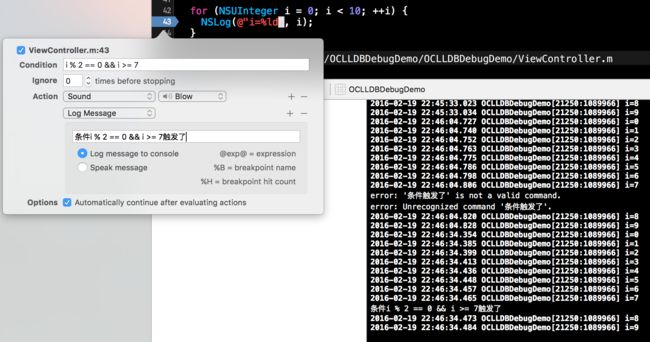
在NSLog打印的这一行,设置了条件,使其条件满足的时候,断点起作用,在这里是让其发出声音并且打印到控制台
这种场景主要是用做替代单步跟踪减少一步步的调试的问题,只是调试我们比较关心的条件下的调试。
7、打印试图的层次结构
为了在调试的过程中,掌握试图的层次结构以及位置等信息,我们可以使用调用recursiveDescription方法来打印出来,层次结构一目了然
(lldb) po [self.view recursiveDescription]
>
   | >
   |    | >
   |    |    | <_UILabelContentLayer: 0x7fdd12804f30> (layer)
   | <_UILayoutGuide: 0x7fdd1052b300; frame = (0 0; 0 20); hidden = YES; layer = >
   | <_UILayoutGuide: 0x7fdd1052c070; frame = (0 568; 0 0); hidden = YES; layer = >
8、临时刷新界面UI
本例使用的是在controller中调试中改变view的背景色
(lldb) e self.view.backgroundColor = [UIColor yellowColor]**
(UICachedDeviceRGBColor *) $0 = 0x00007ff071f3dba0
(lldb) e (void)[CATransaction flush]**
执行完以上命令后 界面view变为黄色
9、 修改变量的值
在调试过程可以使用expr改变变量的值
使用规则
expr variable = newValue
10、其他调试的命令(通过help打印出来的可以起看看)
(lldb) help
Debugger commands:

  apropos           -- Find a list of debugger commands related to a particular
                       word/subject.
  breakpoint        -- A set of commands for operating on breakpoints. Also see
                       _regexp-break.
  command           -- A set of commands for managing or customizing the
                       debugger commands.
  disassemble       -- Disassemble bytes in the current function, or elsewhere
                       in the executable program as specified by the user.
  expression        -- Evaluate an expression (ObjC++ or Swift) in the current
                       program context, using user defined variables and
                       variables currently in scope.
  frame             -- A set of commands for operating on the current thread's
                       frames.
  gdb-remote        -- Connect to a remote GDB server.  If no hostname is
                       provided, localhost is assumed.
  gui               -- Switch into the curses based GUI mode.
  help              -- Show a list of all debugger commands, or give details
                       about specific commands.
  kdp-remote        -- Connect to a remote KDP server.  udp port 41139 is the
                       default port number.
  language          -- A set of commands for managing language-specific
                       functionality.'.
  log               -- A set of commands for operating on logs.
  memory            -- A set of commands for operating on memory.
  platform          -- A set of commands to manage and create platforms.
  plugin            -- A set of commands for managing or customizing plugin
                       commands.
  process           -- A set of commands for operating on a process.
  quit              -- Quit out of the LLDB debugger.
  register          -- A set of commands to access thread registers.
  script            -- Pass an expression to the script interpreter for
                       evaluation and return the results. Drop into the
                       interactive interpreter if no expression is given.
  settings          -- A set of commands for manipulating internal settable
                       debugger variables.
  source            -- A set of commands for accessing source file information
  target            -- A set of commands for operating on debugger targets.
  thread            -- A set of commands for operating on one or more threads
                       within a running process.
  type              -- A set of commands for operating on the type system
  version           -- Show version of LLDB debugger.
  watchpoint        -- A set of commands for operating on watchpoints.

Current command abbreviations (type 'help command alias' for more info):

  add-dsym  -- ('target symbols add')  Add a debug symbol file to one of the
               target's current modules by specifying a path to a debug symbols
               file, or using the options to specify a module to download
               symbols for.
  attach    -- ('_regexp-attach')  Attach to a process id if in decimal,
               otherwise treat the argument as a process name to attach to.
  b         -- ('_regexp-break')  Set a breakpoint using a regular expression
               to specify the location, where  is in decimal and
                is in hex.
  bt        -- ('_regexp-bt')  Show a backtrace.  An optional argument is
               accepted; if that argument is a number, it specifies the number
               of frames to display.  If that argument is 'all', full
               backtraces of all threads are displayed.
  c         -- ('process continue')  Continue execution of all threads in the
               current process.
  call      -- ('expression --')  Evaluate an expression (ObjC++ or Swift) in
               the current program context, using user defined variables and
               variables currently in scope.
  continue  -- ('process continue')  Continue execution of all threads in the
               current process.
  detach    -- ('process detach')  Detach from the current process being
               debugged.
  di        -- ('disassemble')  Disassemble bytes in the current function, or
               elsewhere in the executable program as specified by the user.
  dis       -- ('disassemble')  Disassemble bytes in the current function, or
               elsewhere in the executable program as specified by the user.
  display   -- ('_regexp-display')  Add an expression evaluation stop-hook.
  down      -- ('_regexp-down')  Go down "n" frames in the stack (1 frame by
               default).
  env       -- ('_regexp-env')  Implements a shortcut to viewing and setting
               environment variables.
  exit      -- ('quit')  Quit out of the LLDB debugger.
  f         -- ('frame select')  Select a frame by index from within the
               current thread and make it the current frame.
  file      -- ('target create')  Create a target using the argument as the
               main executable.
  finish    -- ('thread step-out')  Finish executing the function of the
               currently selected frame and return to its call site in
               specified thread (current thread, if none specified).
  image     -- ('target modules')  A set of commands for accessing information
               for one or more target modules.
  j         -- ('_regexp-jump')  Sets the program counter to a new address.
  jump      -- ('_regexp-jump')  Sets the program counter to a new address.
  kill      -- ('process kill')  Terminate the current process being debugged.
  l         -- ('_regexp-list')  Implements the GDB 'list' command in all of
               its forms except FILE:FUNCTION and maps them to the appropriate
               'source list' commands.
  list      -- ('_regexp-list')  Implements the GDB 'list' command in all of
               its forms except FILE:FUNCTION and maps them to the appropriate
               'source list' commands.
  n         -- ('thread step-over')  Source level single step in specified
               thread (current thread, if none specified), stepping over calls.
  next      -- ('thread step-over')  Source level single step in specified
               thread (current thread, if none specified), stepping over calls.
  nexti     -- ('thread step-inst-over')  Single step one instruction in
               specified thread (current thread, if none specified), stepping
               over calls.
  ni        -- ('thread step-inst-over')  Single step one instruction in
               specified thread (current thread, if none specified), stepping
               over calls.
  p         -- ('expression --')  Evaluate an expression (ObjC++ or Swift) in
               the current program context, using user defined variables and
               variables currently in scope.
  po        -- ('expression -O  -- ')  Evaluate an expression (ObjC++ or Swift)
               in the current program context, using user defined variables and
               variables currently in scope.
  print     -- ('expression --')  Evaluate an expression (ObjC++ or Swift) in
               the current program context, using user defined variables and
               variables currently in scope.
  q         -- ('quit')  Quit out of the LLDB debugger.
  r         -- ('process launch -X true --')  Launch the executable in the
               debugger.
  rbreak    -- ('breakpoint set -r %1')  Sets a breakpoint or set of
               breakpoints in the executable.
  repl      -- ('expression -r  -- ')  Evaluate an expression (ObjC++ or Swift)
               in the current program context, using user defined variables and
               variables currently in scope.
  run       -- ('process launch -X true --')  Launch the executable in the
               debugger.
  s         -- ('thread step-in')  Source level single step in specified thread
               (current thread, if none specified).
  si        -- ('thread step-inst')  Single step one instruction in specified
               thread (current thread, if none specified).
  step      -- ('thread step-in')  Source level single step in specified thread
               (current thread, if none specified).
  stepi     -- ('thread step-inst')  Single step one instruction in specified
               thread (current thread, if none specified).
  t         -- ('thread select')  Select a thread as the currently active
               thread.
  tbreak    -- ('_regexp-tbreak')  Set a one shot breakpoint using a regular
               expression to specify the location, where  is in
               decimal and  is in hex.
  undisplay -- ('_regexp-undisplay')  Remove an expression evaluation
               stop-hook.
  up        -- ('_regexp-up')  Go up "n" frames in the stack (1 frame by
               default).
  x         -- ('memory read')  Read from the memory of the process being
               debugged.

For more information on any command, type 'help '.