写在前面的话
泰坦尼克号的沉没是历史上最臭名昭著的海难。1912年4月5日,在她的处女航上,泰坦尼克号由于撞上冰山而沉没,使得2224人中的1502永远的葬身海底。Machine Learning from Disaster 是Kaggle知名的数据分析入门练手项目,参与者需要完成:数据预处理、特征工程、建模、预测、验证步骤,实现根据给出的891行训练数据(包含乘客或海员信息,以及是否生还)训练出的数据模型来预测其他418条记录的乘客的生存情况,由于此项目真实模拟了现实数据分析过程流程,被评为五大最适合数据分析练手项目之一。
Five data science projects to learn data science
本文的基本按照下述流程进行Machine Learning from Disaster数据集进行分析:
- 数据清洗
- 特征工程
- 模型设计
- 预测
数据预处理
数据集来源
- 训练数据集:train.csv;
- 预测数据集:test.csv;
https://www.kaggle.com/c/titanic
数据导入与预览
# 创建工程:Machine Learning from Disaster
# 加载包
library(dplyr)
library(stringr)
library(ggthemes)
library(ggplot2)

#加载完成后,导入数据
test<- read.csv("./db/test.csv", header = T, stringsAsFactors = F)
train <- read.csv("./db/train.csv", header = T, stringsAsFactors = F)

# 初步观察数据
# 检查数据
str(train)
str(test)
head(train)
head(test)
从结果可知:两个的数据集除了test缺失Survived列,两者数据框中的元素是完全一致
> str(train)
'data.frame':   891 obs. of  12 variables:
 $ PassengerId: int  1 2 3 4 5 6 7 8 9 10 ...
 $ Survived   : int  0 1 1 1 0 0 0 0 1 1 ...
 $ Pclass     : int  3 1 3 1 3 3 1 3 3 2 ...
 $ Name       : chr  "Braund, Mr. Owen Harris" "Cumings, Mrs. John Bradley (Florence Briggs Thayer)" "Heikkinen, Miss. Laina" "Futrelle, Mrs. Jacques Heath (Lily May Peel)" ...
 $ Sex        : chr  "male" "female" "female" "female" ...
 $ Age        : num  22 38 26 35 35 NA 54 2 27 14 ...
 $ SibSp      : int  1 1 0 1 0 0 0 3 0 1 ...
 $ Parch      : int  0 0 0 0 0 0 0 1 2 0 ...
 $ Ticket     : chr  "A/5 21171" "PC 17599" "STON/O2. 3101282" "113803" ...
 $ Fare       : num  7.25 71.28 7.92 53.1 8.05 ...
 $ Cabin      : chr  "" "C85" "" "C123" ...
 $ Embarked   : chr  "S" "C" "S" "S" ...

> head(test)
 PassengerId Survived Pclass                                                Name    Sex Age SibSp Parch
1           1        0      3                             Braund, Mr. Owen Harris   male  22     1     0
2           2        1      1 Cumings, Mrs. John Bradley (Florence Briggs Thayer) female  38     1     0
3           3        1      3                              Heikkinen, Miss. Laina female  26     0     0
4           4        1      1        Futrelle, Mrs. Jacques Heath (Lily May Peel) female  35     1     0
5           5        0      3                            Allen, Mr. William Henry   male  35     0     0
6           6        0      3                                    Moran, Mr. James   male  NA     0     0
            Ticket    Fare Cabin Embarked
1        A/5 21171  7.2500              S
2         PC 17599 71.2833   C85        C
3 STON/O2. 3101282  7.9250              S
4           113803 53.1000  C123        S
5           373450  8.0500              S
6           330877  8.4583              Q
数据预处理
# 在test数据集中增加Survieved列
test.survived <- data.frame(Survived = rep("None", nrow(test)),test[,] )
# 将test 和 train数据集聚合
data.combined <- rbind(train,test.survived)
data.combined$Survived <- as.factor(data.combined$Survived)
data.combined$Pclass <- as.factor(data.combined$Pclass)
合并后的数据有生存情况(Survived)中有未知值N、418个(需要预测的),年龄(Age)中缺失值有263个,船票费用(Fare)中缺失值有1个。
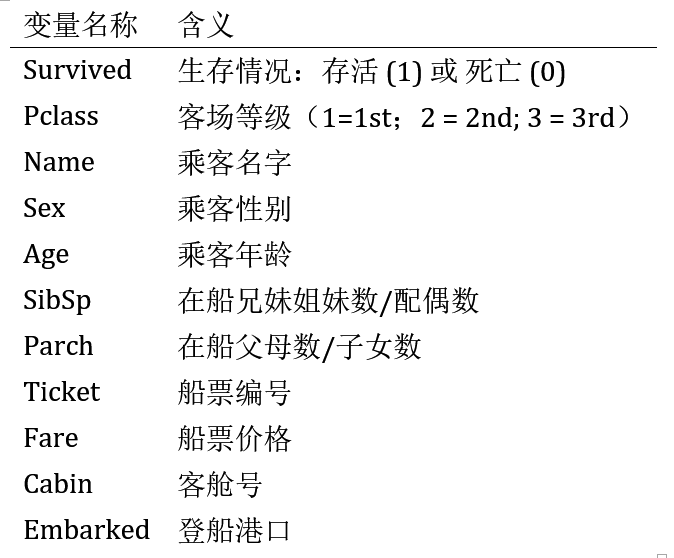
目前,我们已经对test,train数据集有初步的了解,其中训练集891个,测试集418个。 我们的目标是要预测生存情况(Survived)——因变量,而可供使用的自变量11个,如下图所示。
特征工程
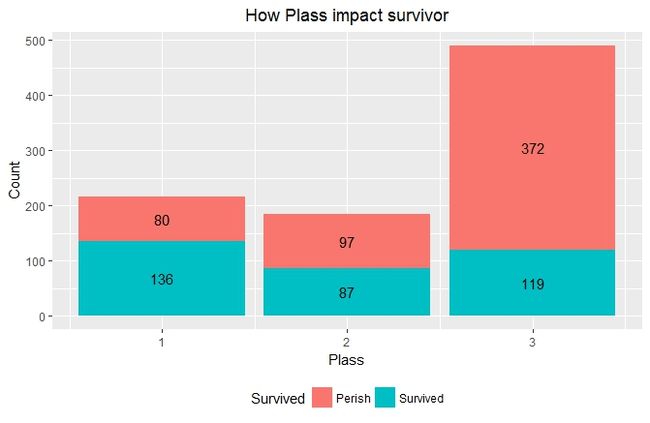
假设船舱等级越高,幸存率越高
  ggplot(train,aes(x = Pclass, y = ..count.., fill=factor(Survived))) +
  geom_bar(stat = "count", position='stack') +
  xlab('Plass') +
  ylab('Count') +
  ggtitle('How Plass impact survivor') +
  scale_fill_discrete(name="Survived", breaks=c(0, 1), labels=c("Perish", "Survived")) +
  geom_text(stat = "count", aes(label = ..count..), position=position_stack(vjust = 0.5)) +
  theme(plot.title = element_text(hjust = 0.5), legend.position="bottom")
- 从图中可很明显看出船舱等级越高,幸存率越高,随着船舱等级下降,幸存率也从62.9%降到24.2%
假设乘客名字(Name)具有特征潜力
在乘客名字(Name)中,有一个非常显著的特点:乘客头衔每个名字当中都包含了具体的称谓或者说是头衔,将这部分信息提取出来后可以作为非常有用一个新变量,可以帮助我们预测。
# 从乘客名字中提取头衔
data.combined$Title <- gsub('(.*, )|(\\..*)', '', data.combined$Name)
as.factor(data.combined$Title)
table(data.combined$Title)

        Capt          Col          Don         Dona           Dr     Jonkheer         Lady        Major
           1            4            1            1            8            1            1            2
      Master         Miss         Mlle          Mme           Mr          Mrs           Ms          Rev
          61          260            2            1          757          197            2            8
         Sir the Countess
           1            1
- 上面列出的Title: Miss、Mlle、Mme、Mrs、Mr、Ms、Lady、Major、Capt、Col、Sir具有明显的性别提示,而Rev、Master,Jonkheer、Don、Dona,Dr性别不可得知
data.combined[which(data.combined$Title %in% "Master"), "Sex"]
 [1] "male" "male" "male" "male" "male" "male" "male" "male" "male" "male" "male" "male" "male" "male"
[15] "male" "male" "male" "male" "male" "male" "male" "male" "male" "male" "male" "male" "male" "male"
[29] "male" "male" "male" "male" "male" "male" "male" "male" "male" "male" "male" "male" "male" "male"
[43] "male" "male" "male" "male" "male" "male" "male" "male" "male" "male" "male" "male" "male" "male"
[57] "male" "male" "male" "male" "male"

> data.combined[which(data.combined$Title %in% "Rev"), "Sex"]
[1] "male" "male" "male" "male" "male" "male" "male" "male"

> data.combined[which(data.combined$Title %in% "Jonkheer"), "Sex"]
[1] "male"
> data.combined[which(data.combined$Title %in% "Don"), "Sex"]
[1] "male"
> data.combined[which(data.combined$Title %in% "Dona"), "Sex"]
[1] "female"
> data.combined[which(data.combined$Title %in% "Dr"), "Sex"]
[1] "male"   "male"   "male"   "male"   "male"   "male"   "female" "male"
-注意到Title具有非常强的性别倾向,除了Dr外,各个Title都是单性别属性,换句话说,Title包含有和Sex(性别)重复的信息,有可将其替换的潜质
性别(Sex)特征影响
ggplot(data.combined[1:891,],aes(x = Sex, y = ..count.., fill=factor(Survived))) +
  geom_bar(stat = "count", position='stack') +
  facet_wrap(~Pclass) +
  xlab('Sex') +
  ylab('Count') +
  ggtitle('How Sex impact survivor') +
  scale_fill_discrete(name="Survived", breaks=c(0, 1), labels=c("Perish", "Survived")) +
  geom_text(stat = "count", aes(label = ..count..), position=position_stack(vjust = 0.5)) +
  theme(plot.title = element_text(hjust = 0.5), legend.position="bottom")
-- 从图中可以看出各个船舱呈现出一致的规律,女性的幸存率更高
年龄(Age)特征影响
> summary(data.combined[1:891,"Age"])
   Min. 1st Qu.  Median    Mean 3rd Qu.    Max.    NA's
   0.42   20.12   28.00   29.70   38.00   80.00     177
ggplot(data.combined[which(!is.na(data.combined[1:891,"Age"])),], aes(x = Age, fill=factor(Survived))) + facet_wrap(~Sex + Pclass) +
  geom_histogram(binwidth = 10) +
  xlab("Age") +
  ylab("Total Count")

> summary(data.combined[which(data.combined$Title %in% "Master"), "Age"])
   Min. 1st Qu.  Median    Mean 3rd Qu.    Max.    NA's
  0.330   2.000   4.000   5.483   9.000  14.500       8
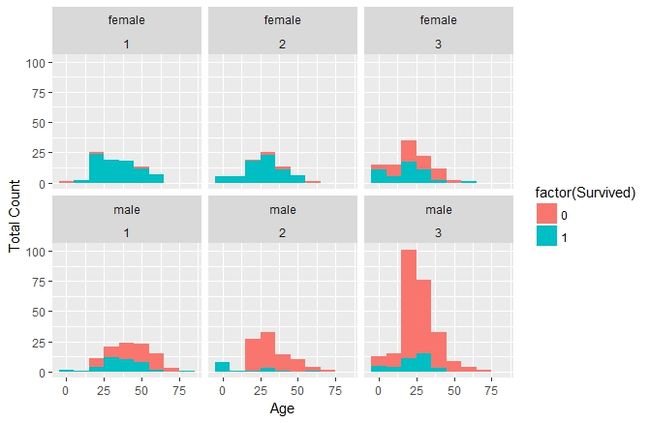
- 年龄列存在177个缺失值,占到train数据集的将近20%左右,剔除缺失值后,并不能看出其呈现何种明显规律,但无意中发现Master的年龄分布,推断其代表意义是:未成年男性
家庭组成人数特征影响
SibSp(兄弟姐妹及配偶的个数)影响
data.combined$SibSp <- as.factor(data.combined$SibSp)
ggplot(data.combined[1:891,],aes(x = SibSp, y = ..count.., fill=factor(Survived))) +
  geom_bar(stat = "count", position='stack') +
  facet_wrap(~Pclass+Title) +
  xlab('SibSp') +
  ylab('Count') +
  ggtitle('How Sibsp impact survivor') +
  scale_fill_discrete(name="Survived", breaks=c(0, 1), labels=c("Perish", "Survived")) +
  geom_text(stat = "count", aes(label = ..count..), position=position_stack(vjust = 0.5)) +
  theme(plot.title = element_text(hjust = 0.5), legend.position="bottom")
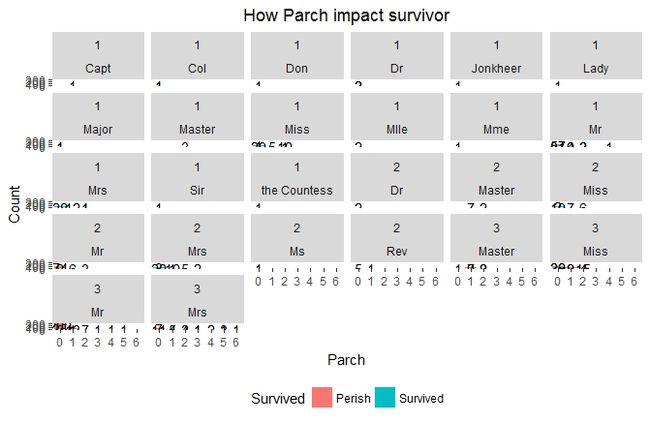
Parch(父母或子女的个数)影响
data.combined$Parch <- as.factor(data.combined$Parch)
ggplot(data.combined[1:891,],aes(x = Parch, y = ..count.., fill=factor(Survived))) +
  geom_bar(stat = "count", position='stack') +
  facet_wrap(~Pclass+Title) +
  xlab('Parch') +
  ylab('Count') +
  ggtitle('How Parch impact survivor') +
  scale_fill_discrete(name="Survived", breaks=c(0, 1), labels=c("Perish", "Survived")) +
  geom_text(stat = "count", aes(label = ..count..), position=position_stack(vjust = 0.5)) +
  theme(plot.title = element_text(hjust = 0.5), legend.position="bottom")
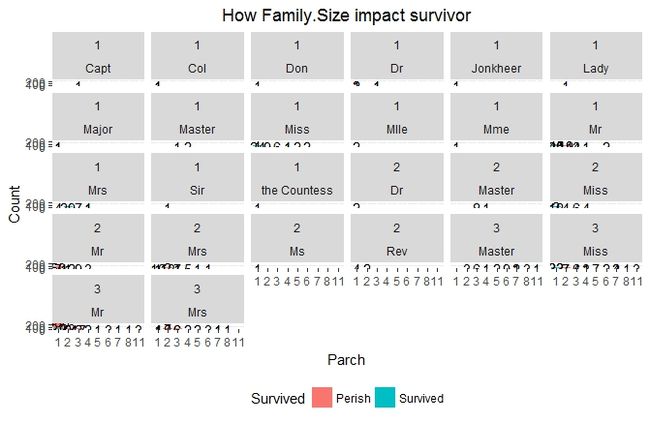
家庭总人数(Family.size)影响
Temp.SibSp <- c(train$SibSp, test$SibSp)
Temp.Parch <- c(train$Parch, test$Parch)
data.combined$family.size <- as.factor(Temp.SibSp + Temp.Parch + 1)

ggplot(data.combined[1:891,],aes(x = family.size, y = ..count.., fill=factor(Survived))) +
  geom_bar(stat = "count", position='stack') +
  facet_wrap(~Pclass+Title) +
  xlab('Parch') +
  ylab('Count') +
  ggtitle('How Parch impact survivor') +
  scale_fill_discrete(name="Survived", breaks=c(0, 1), labels=c("Perish", "Survived")) +
  geom_text(stat = "count", aes(label = ..count..), position=position_stack(vjust = 0.5)) +
  theme(plot.title = element_text(hjust = 0.5), legend.position="bottom")
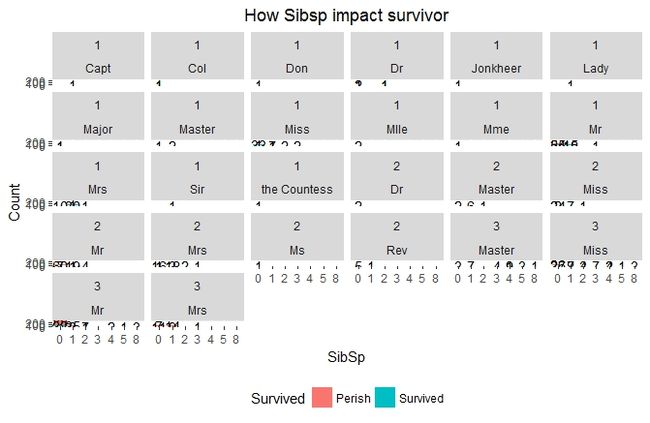
- 总体上,家庭成员对应的列:SibSp、Parch、family.size算是弱特征值,有家庭成员的乘客更有生还的机会
船票号(Ticket)特征影响
#船票号(Ticket)是字符类型数据
> data.combined$Ticket[1:20]
 [1] "A/5 21171"        "PC 17599"         "STON/O2. 3101282" "113803"           "373450"
 [6] "330877"           "17463"            "349909"           "347742"           "237736"
[11] "PP 9549"          "113783"           "A/5. 2151"        "347082"           "350406"
[16] "248706"           "382652"           "244373"           "345763"           "2649"
-- 数据很杂乱,没有规律可寻
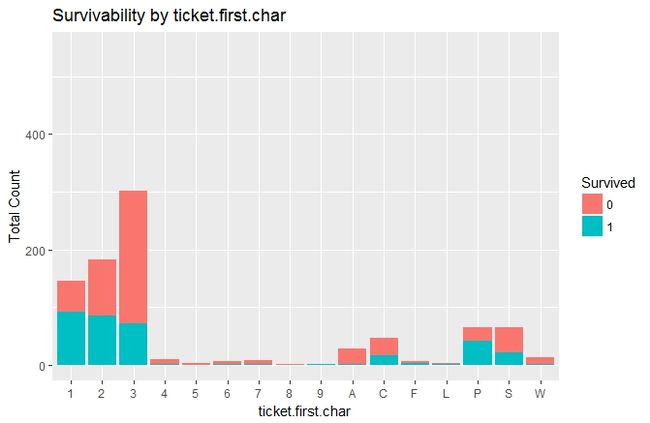
#提取船票号(Ticket)首字母作为Factor后统计
Ticket.first.char <- ifelse(data.combined$Ticket == "", " ", substr(data.combined$Ticket, 1, 1))
> unique(Ticket.first.char)
 [1] "A" "P" "S" "1" "3" "2" "C" "7" "W" "4" "F" "L" "9" "6" "5" "8"
data.combined$Ticket.first.char <- as.factor(Ticket.first.char)

#罗列出购买不同Ticket的乘客的生存状况
ggplot(data.combined[1:891,], aes(x = Ticket.first.char, fill=factor(Survived))) +
  geom_bar() +
  ggtitle("Survivability by ticket.first.char") +
  xlab("ticket.first.char") +
  ylab("Total Count") +
  ylim(0,350) +
  labs(fill = "Survived")
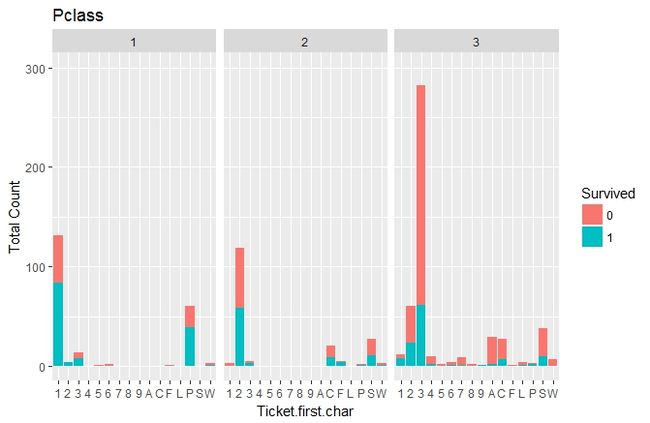
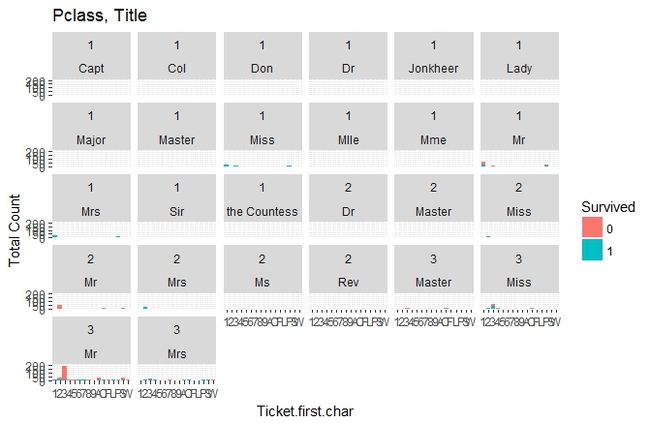
#罗列出购买不同Ticket的乘客在不同船舱的生存状况
ggplot(data.combined[1:891,], aes(x = Ticket.first.char, fill=factor(Survived))) +
  geom_bar() +
  facet_wrap(~Pclass) +
  ggtitle("Pclass") +
  xlab("Ticket.first.char") +
  ylab("Total Count") +
  ylim(0,300) +
  labs(fill = "Survived")
##罗列出购买不同Ticket的乘客在不同船舱的生存状况
ggplot(data.combined[1:891,], aes(x = Ticket.first.char, fill=factor(Survived))) +
  geom_bar() +
  facet_wrap(~Pclass) +
  ggtitle("Pclass") +
  xlab("Ticket.first.char") +
  ylab("Total Count") +
  ylim(0,300) +
  labs(fill = "Survived")
-- 总体上,船票号(Ticket)是弱特征值,没有表现出明显的规律
船票费用特征影响
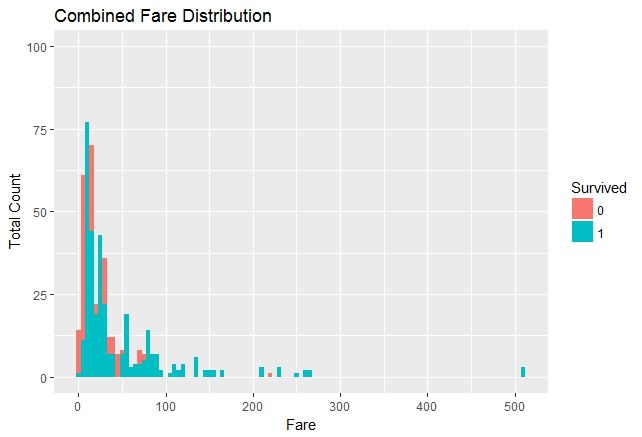
##不同船票费用乘客员生还分布情况
ggplot(data.combined[which(!is.na(data.combined[1:891,"Fare"])), ], aes(x = Fare,fill = Survived)) +
  geom_histogram(binwidth = 5,position="identity") +
  ggtitle("Combined Fare Distribution") +
  xlab("Fare") +
  ylab("Total Count") +
  ylim(0,100)
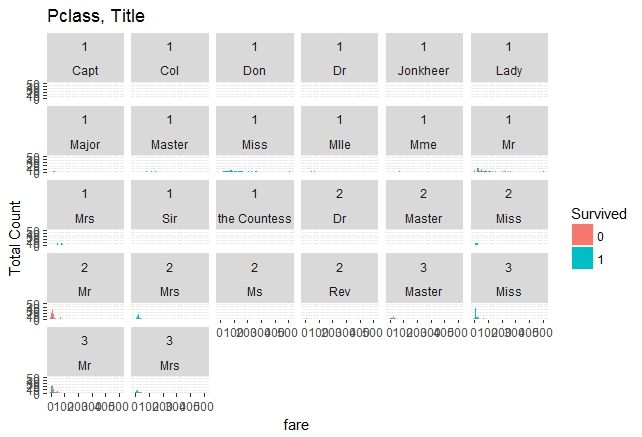
# 在各船舱,Title不同的情况下,不同船票费用乘客员生还分布情况
ggplot(data.combined[which(!is.na(data.combined[1:891,"Fare"])), ], aes(x = Fare, fill = Survived)) +
  geom_histogram(binwidth = 5,position="identity") +
  facet_wrap(~Pclass + Title) +
  ggtitle("Pclass, Title") +
  xlab("fare") +
  ylab("Total Count") +
  ylim(0,50) +
  labs(fill = "Survived")
- 无规律可寻,暂不作为特征考虑
Cabin(客舱号)特征影响
str(data.combined$Cabin)
chr [1:1309] "" "C85" "" "C123" "" "" "E46" "" "" "" "G6" "C103" "" "" "" "" "" "" "" "" "" "D56" "" ...
# Cabin(客舱号)是字符型
# 观察Cabin(客舱号)分布,可以看到有很多缺失值,而且分布比较杂乱
> head(data.combined$Cabin,20)
 [1] ""     "C85"  ""     "C123" ""     ""     "E46"  ""     ""     ""     "G6"   "C103" ""     ""
[15] ""     ""     ""     ""     ""     ""

#填补缺失值
data.combined[which(data.combined$Cabin == ""), "Cabin"] <- "U"
data.combined$Cabin[1:20]
 [1] "U"    "C85"  "U"    "C123" "U"    "U"    "E46"  "U"    "U"    "U"    "G6"   "C103" "U"    "U"
[15] "U"    "U"    "U"    "U"    "U"    "U"

#通过因子转换试图去找出分类
cabin.first.char <- as.factor(substr(data.combined$Cabin, 1, 1))
str(cabin.first.char)
levels(cabin.first.char)
[1] "A" "B" "C" "D" "E" "F" "G" "T" "U"

ggplot(data.combined[1:891,],aes(x = cabin.first.char, y = ..count.., fill=factor(Survived))) +
  geom_bar(stat = "count", position='stack') +
  facet_wrap(~Pclass) +
  xlab('Parch') +
  ylab('Count') +
  ggtitle('How Cabin impact survivor') +
  scale_fill_discrete(name="Survived", breaks=c(0, 1), labels=c("Perish", "Survived")) +
  geom_text(stat = "count", aes(label = ..count..), position=position_stack(vjust = 0.5)) +
  theme(plot.title = element_text(hjust = 0.5), legend.position="bottom")
- 缺失值较多,再加上无明显特征规律,初步判定无特征资质
登录港口(Embarked)特征影响
#登录港口(Embarked):C = Cherbourg, Q = Queenstown, S = Southampton三个,适合作为Factor(因子)处理
str(data.combined$Embarked)
levels(as.factor(data.combined$Embarked))
[1] ""  "C" "Q" "S"

#train数据集中有2个缺失值,个数相对总数来说可忽略不计
table(data.combined[1:891,"Embarked"])

      C   Q   S
  2 168  77 644

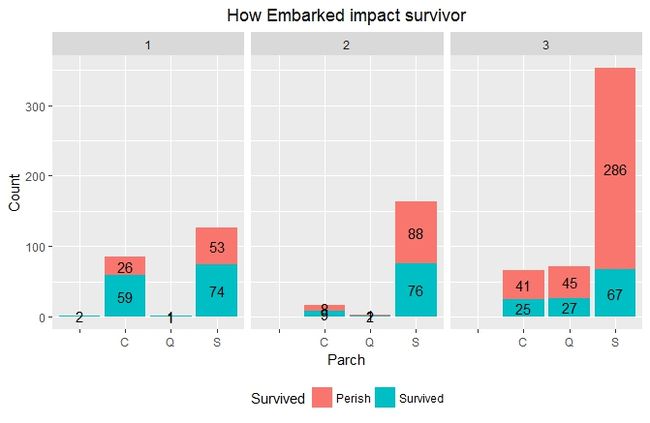
ggplot(data.combined[1:891,],aes(x = Embarked, y = ..count.., fill=factor(Survived))) +
  geom_bar(stat = "count", position='stack') +
  facet_wrap(~Pclass) +
  xlab('Parch') +
  ylab('Count') +
  ggtitle('How Embarked impact survivor') +
  scale_fill_discrete(name="Survived", breaks=c(0, 1), labels=c("Perish", "Survived")) +
  geom_text(stat = "count", aes(label = ..count..), position=position_stack(vjust = 0.5)) +
  theme(plot.title = element_text(hjust = 0.5), legend.position="bottom")
- 初步判断无明显特征规律,可判断其无特征属性
经过对以下变量:船舱等级、名字、性别、年龄、家庭组成人数、船票号、
船票费用、客舱号、登录港口的特征影响排查,可认为船舱等级、名字中的Title、性别、家庭组成人数具有明显的特征属性,其他变量没有呈现明显的特征规律,为避免过度拟合需要舍弃,同时名字中的Title变量有包含性别信息,如果同时将名字中的Title、性别都作为自变量的话,也可能会造成过度拟合,需要警惕。
模型设计
经过对变量:船舱等级、名字、性别、年龄、家庭组成人数、船票号、
船票费用、客舱号、登录港口的特征影响排查,可认为船舱等级、名字中的Title、性别、家庭组成人数具有明显的特征属性,其他变量没有呈现明显的特征规律,为避免过度拟合需要舍弃,同时名字中的Title变量有包含性别信息,如果同时将名字中的Title、性别都作为自变量的话,也可能会造成过度拟合,需要警惕。
接下来要建立模型预测泰坦尼克号上乘客的生存状况。 在这,我们使用随机森林分类算法(The RandomForest Classification Algorithm) ,至于前期的那么多工作都是为了这一步骤服务的。
#加载randomForest包
library(randomForest)
test.subset <-data.combined[1:891,]
test.subset$Title<-as.factor(test.subset$Title)

#选择Pclass和Title两个自变量
set.seed(1234)
forest_Pclass_Title <- randomForest(factor(Survived)~Pclass+Title,
                       data=test.subset,
                       importance=TRUE,
                       ntree=1000)
varImpPlot(forest_Pclass_Title)

#错误率统计
> forest_Pclass_Title

Call:
 randomForest(formula = factor(Survived) ~ Pclass + Title, data = test.subset,      importance = TRUE, ntree = 1000)
               Type of random forest: classification
                     Number of trees: 1000
No. of variables tried at each split: 1

        OOB estimate of  error rate: 20.76%
Confusion matrix:
    0   1 class.error
0 533  16   0.0291439
1 169 173   0.4941520
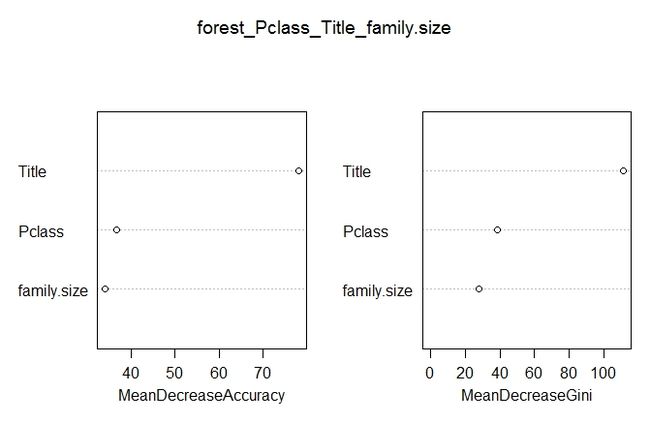
#选择Pclass、Title、family.size三个自变量
set.seed(1234)
forest_Pclass_Title_family.size <- randomForest(factor(Survived)~Pclass+Title+family.size,
                                    data=test.subset,
                                    importance=TRUE,
                                    ntree=1000)
varImpPlot(forest_Pclass_Title_family.size)

#可以发现择Pclass、Title、family.size三个自变量,比但选择Pclass、Title,准确率要高出3.2%左右
> forest_Pclass_Title_family.size

Call:
 randomForest(formula = factor(Survived) ~ Pclass + Title + family.size,      data = test.subset, importance = TRUE, ntree = 1000)
               Type of random forest: classification
                     Number of trees: 1000
No. of variables tried at each split: 1

        OOB estimate of  error rate: 17.51%
Confusion matrix:
    0   1 class.error
0 485  64   0.1165756
1  92 250   0.2690058
通过上述比较,得到最优的结果的选择自变量是:Pclass、Title、family.size。
实验时,我们也特地将前面我们已经认为无特征属性的各自变量加入测试,而得到的结果则是导致总体的出错率增加,这里就不再赘述。
- MeanDecreaseAccuracy衡量把一个变量的取值变为随机数,随机森林预测准确性的降低程度。该值越大表示该变量的重要性越大
- MeanDecreaseGini通过基尼(Gini)指数计算每个变量对分类树每个节点上观测值的异质性的影响,从而比较变量的重要性。该值越大表示该变量的重要性越大
预测
模型和自变量都确定,最后一步就是预测结果了,在这里可以把上面刚建立的模型直接应用在测试集上。
validate_subset <- data.combined[892:1309,]
# 基于测试集进行预测
prediction <- predict(forest_Pclass_Title_family.size,validate_subset)

# 将结果保存为数据框,按照Kaggle提交文档的格式要求。
solution <- data.frame(PassengerID = validate_subset$PassengerId, Survived = prediction)

# 将结果写入文件
write.csv(solution, file = 'rf_mod_Solution1.csv', row.names = F)
得到的文件后,就可以上传Kaggle获取自己的排名情况啦~
比赛页面:Titanic: Machine Learning from Disaster
以下就是这次实验的排名结果:
- 比赛成绩排名在前26%,不算是理想,还有很多的进步空间
总结
本篇文章是参考的《 Introduction to Data Science with R》教程步骤逐步的进行,完成的工作只是初步阶段,后面会做以下改进工作
- 各自变量的缺失值处理
- 交叉验证
- 使用其他算法建立模型预测

