典型医学设计实验GEO数据分析 (step-by-step) - 数据获取到标准化介绍了实验的设计、数据获取、数据标准化和注释,下面是如何利用Limma和线性模型鉴定差异基因,并进行GO富集分析。
线性模型
为了分析发炎和未发炎组织的差异表达,我们需要构建一个线性模型。线性模式是实验数据分析的常用方法,适用于几乎任何复杂的实验设计。后面我们专门出文介绍,推荐Mike Love和Michael Irizzary的genomics class和可汗学院的线性代数免费公开课。
我们这里主要用limma包构建线性模型进行差异表达分析。这个包可以同时比较很多实验组并且尽量维持其易用性。首先对每个基因的表达拟合一个线性模型,然后用经验贝叶斯 (Empirical Bayes)或其他方法进行残差分析获得合适的t统计量,并针对小样本实验的方差估计进行优化,使得分析结果更加可靠。
在构建线性模型时,采用缩写UC和CD代表疾病类型,non_infl.和infl.代表发炎与否。
# 获得所有的个体信息
individual <-   as.character(Biobase::pData(palmieri_final)$Characteristics.individual.)
# 组织信息的空格替换为下划线
tissue <- str_replace_all(Biobase::pData(palmieri_final)$Factor.Value.phenotype.,                  " ", "_")
# 简化组织的描述信息tissue <- ifelse(tissue == "non-inflamed_colonic_mucosa",                 "nI", "I")
# 疾病信息替换下划线,并简化描述
disease <-   str_replace_all(Biobase::pData(palmieri_final)$Factor.Value.disease.,                  " ", "_")
disease <-   ifelse(str_detect(Biobase::pData(palmieri_final)$Factor.Value.disease.,                     "Crohn"), "CD", "UC")
因为要找发炎和未发炎组织的差异表达基因,所以理论上只需要比较这两个变量。但因为每个独立的个体有两套芯片检测结果 (发炎和未发炎组织),这是一个配对样品实验设计。下游分析时需要考虑个体差异的影响。如果一个实验特征对结果可能有系统性影响,需要对引入这个特征作为阻断因子 (bolcking factors)。
为了与文章一致,我们为每个疾病分别构建了一个设计矩阵。(也可以针对完整数据集设计一个联合模型,但两种疾病可能特征差别很大,放在一起可能不太合适,从典型医学设计实验GEO数据分析 (step-by-step) - 数据获取到标准化文中的PCA结果也可以看出来)
# 获得CD疾病的个体
i_CD <- individual[disease == "CD"]
# 获得两种组织类型和个体的矩阵
# 0 + 表示不设置截距项,所有样品都有自己的回归系数
design_palmieri_CD <- model.matrix(~ 0 + tissue[disease == "CD"] + i_CD)
colnames(design_palmieri_CD)[1:2] <- c("I", "nI")
rownames(design_palmieri_CD) <- i_CD

i_UC <- individual[disease == "UC"]
design_palmieri_UC <- model.matrix(~ 0 + tissue[disease == "UC"] + i_UC )
colnames(design_palmieri_UC)[1:2] <- c("I", "nI")
rownames(design_palmieri_UC) <- i_UC
检查下设计矩阵:
head(design_palmieri_CD[, 1:6])

##      I nI i_CD183 i_CD2114 i_CD2209 i_CD2255
## 164  0  1       0        0        0        0
## 164  1  0       0        0        0        0
## 183  0  1       1        0        0        0
## 183  1  0       1        0        0        0
## 2114 0  1       0        1        0        0
## 2114 1  0       0        1        0        0

head(design_palmieri_UC[, 1:6])

##      I nI i_UC2424 i_UC2987 i_UC2992 i_UC2995
## 2400 0  1        0        0        0        0
## 2400 1  0        0        0        0        0
## 2424 0  1        1        0        0        0
## 2424 1  0        1        0        0        0
## 2987 0  1        0        1        0        0
## 2987 1  0        0        1        0        0
设计矩阵 (design matrix)中行代表每个芯片,列代表囊括入线性模型的变量,包含是否发炎,个体信息。i_UC2424是病人2424的变量,UC代表病人所患疾病。 矩阵中的0和1代表所属关系 (也称激活状态)。
在线性模型中,第一个个体 (设计矩阵第一行)会作为其他个体的基准,不会包含到样品变量中。这里~0是去除截距项,每个样品都计算回归系数。
除了像上面把个体作为blocking factor的方式,也可以构建混合模型 (mixed model),增加random effect,以后再详细讲述。
单个基因差异表达分析测试
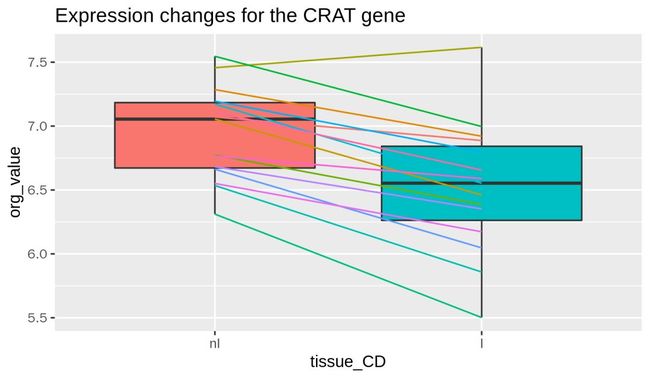
先选择一个基因查看其分布和拟合出的线性模型,这里选择的是PROBEID为8164535,gene symbol为CRAT的基因。
首先看下其表达,整体在未发炎样品中高。而且不同病人间基因的绝对表达丰度差别挺大。如果我们没有在设计矩阵中考虑到这个问题,线性模型就会把这些数据视为一个整体。考虑到每个个体的基准表达水平不同,最终获得的差异倍数会有较高的方差。
tissue_CD <- tissue[disease == "CD"]
crat_expr <- Biobase::exprs(palmieri_final)["8164535", disease == "CD"]
crat_data <- as.data.frame(crat_expr)
colnames(crat_data)[1] <- "org_value"
crat_data <- mutate(crat_data, individual = i_CD, tissue_CD)

crat_data$tissue_CD <- factor(crat_data$tissue_CD, levels = c("nI", "I"))

ggplot(data = crat_data, aes(x = tissue_CD, y = org_value)) +
      geom_boxplot(aes(fill=tissue_CD)) +
      geom_line(aes(group = individual, color = individual)) +
      ggtitle("Expression changes for the CRAT gene") +
      theme(legend.position = "none")
我们拟合线性模型计算回归系数。
crat_coef <- lmFit(palmieri_final[,disease == "CD"],
                design = design_palmieri_CD)$coefficients["8164535",]

crat_coef

##        I       nI  i_CD183 i_CD2114 i_CD2209 i_CD2255  i_CD255 i_CD2826
##  6.76669  7.19173  0.12382 -0.22145  0.55759 -0.39905  0.29204 -1.07285
## i_CD2853 i_CD2978  i_CD321 i_CD3262 i_CD3266 i_CD3271 i_CD3302 i_CD3332
## -0.78285 -0.11633  0.01692 -0.62480 -0.46209 -0.61732 -0.30257 -0.09709
设计矩阵 (design_palmieri_CD)与回归系数向量(crat_coef)相乘获得拟合后的表达值。
crat_fitted <- design_palmieri_CD %*% crat_coef
rownames(crat_fitted) <- names(crat_expr)
colnames(crat_fitted) <- "fitted_value"

crat_fitted

##             fitted_value
## 164_I_.CEL         7.192
## 164_II.CEL         6.767
## 183_I.CEL          7.316
## 183_II.CEL         6.891
## 2114_I.CEL         6.970
## 2114_II.CEL        6.545
## 2209_A.CEL         7.749
## 2209_B.CEL         7.324
## 2255_I.CEL         6.793
## 2255_II.CEL        6.368
## 255_I.CEL          7.484
## 255_II.CEL         7.059
## 2826_I.CEL         6.119
## 2826_II.CEL        5.694
## 2853_I.CEL         6.409
## 2853_II.CEL        5.984
## 2978_I.CEL         7.075
## 2978_II.CEL        6.650
## 321_I.CEL          7.209
## 321_II.CEL         6.784
## 3262_I.CEL         6.567
## 3262_II.CEL        6.142
## 3266_I.CEL         6.730
## 3266_II.CEL        6.305
## 3271_I.CEL         6.574
## 3271_II.CEL        6.149
## 3302_I.CEL         6.889
## 3302_II.CEL        6.464
## 3332_I.CEL         7.095
## 3332_II.CEL        6.670
设计矩阵中每一行只有值为1的变量用于计算拟合的表达值,crat_fitted的每一项代表每个样品各个变量回归系数的和。
例如对病人样品 2114_I.CEL 6.9703: 对应的激活变量的回归系数的和 “nI” (7.1917) and “i_CD2114” (-0.2215)。
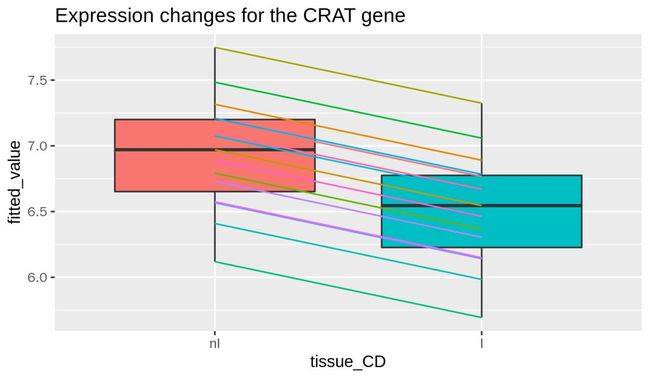
可视化发炎和未发炎组织拟合后的表达值:
crat_data$fitted_value <- crat_fitted

ggplot(data = crat_data, aes(x = tissue_CD, y = fitted_value)) +
      geom_boxplot(aes(fill=tissue_CD)) +
      geom_line(aes(group = individual, color = individual)) +
      ggtitle("Expression changes for the CRAT gene") +
      theme(legend.position = "none")
可以看到,所有病人中发炎组织和未发炎组织的CRAT基因表达差别一致,并且是由变量I(6.7667) 和 nI (7.1917)的回归系数的差值决定。
这是因为一个病人的两个样本的相同blocking variable在设计矩阵中都是激活的,只能在病人内比较。这些blocking variable校正拟合后的组织特异性表达值趋向每个病人的表达值,因此最终的估计是个体内差异的平均值,也就是对应基因的差异倍数 (log2 fold change)。(These blocking variables correct the fitted tissue specific expression values towards the expression levels of the individual patients. Therefore the final estimate is like an average of all the within-individual differences.)
CRAT基因差异表达检测
为了检测基因是否是差异表达,需要执行零假设 (null hypothesis)为基因在发炎和未发炎的样品中表达无差异的t-test。我们的这种设计概念上类似于配对t-test,统计量t的计算如下:
个体间表达值的差异的平均值。配对t-test的方差来源于配对样品。这与标准t-test不同,因此只要配对样品的表达是相关的 ,配对t检验就有更高的统计检出力 (https://en.wikipedia.org/wiki/Paired_difference_test)。
我们通过blocking variable改善了常规t-test的统计检出力。下面就对拟合值进行t-test分析,检测发炎和未发炎的组织中该基因的差异是否显著不同于0。
crat_noninflamed <- na.exclude(crat_data$org_value[tissue == "nI"])
crat_inflamed <- na.exclude(crat_data$org_value[tissue == "I"])
res_t <- t.test(crat_noninflamed, crat_inflamed, paired = TRUE)
res_t

##
##  Paired t-test
##
## data:  crat_noninflamed and crat_inflamed
## t = 6.8, df = 14, p-value = 8e-06
## alternative hypothesis: true difference in means is not equal to 0
## 95 percent confidence interval:
##  0.2919 0.5581
## sample estimates:
## mean of the differences
##                   0.425
统计检测获得p-value值为 0,因此可以说CRAT基因在炎症和非炎症组织中表达差异显著。
这里算出的p-value跟limma输出的有些差异,这是因为limma还会做一个方差校正 (variance moderation)。
设定比较分组进行统计检验
需要比较发炎和未发炎组织的基因表达差异,使用limma包的makeContrasts函数构建只含有一对比较I-nI的比较矩阵。
对所有数据拟合线性模型,并应用 contrasts.fit()鉴定差异表达基因。
contrast_matrix_CD <- makeContrasts(I-nI, levels = design_palmieri_CD)

palmieri_fit_CD <- eBayes(contrasts.fit(lmFit(palmieri_final[,disease == "CD"],
                                design = design_palmieri_CD),
                                contrast_matrix_CD))

contrast_matrix_UC <- makeContrasts(I-nI, levels = design_palmieri_UC)

palmieri_fit_UC <- eBayes(contrasts.fit(lmFit(palmieri_final[,disease == "UC"],
                                design = design_palmieri_UC),
                                contrast_matrix_UC))
这里应用eBayes()函数对模型进行经验贝叶斯方差校正 (empirical Bayes variance moderation)获得校正后的t-统计量。这是因为芯片数据中样本量较少,方差估计困难。通过组合一个先验方差 (prior variance)和每个基因的方差可以改善方差估计,获得校正后的方差 (也称 moderation)。经验贝叶斯 (Empirical Bayes)就是从数据中估算先验方差。eBayes()步骤获得的方差是个体方差向先验值趋近后的结果 (individual variances are shrunken towards the prior value)。
提取差异表达基因
topTable函数可用于提取差异基因。我们获得克罗恩病和溃疡性结肠炎的差异分析结果,并把基因按照绝对t-统计量排序。
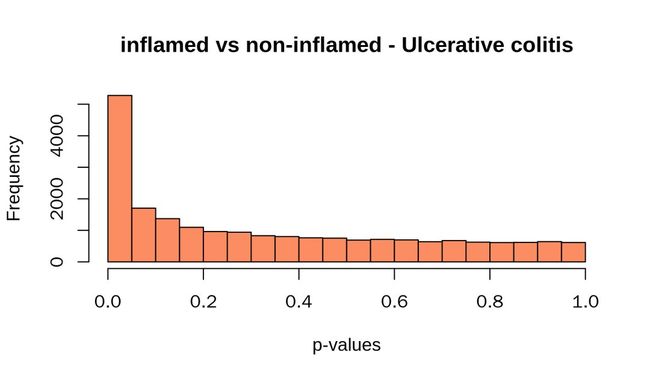
作为质控,我们绘制了p-value分布的直方图 (这是结果检测的很重要标准,后续会专门介绍)。p-value在零假设 (null hypotheses)处应该符合均匀分布,而在0值附近有一个峰,富集差异基因对应的低p-value。
如果某个数据集的p-value分布与这里展示的不同,后续的分析可能会造成误导 (quality loss)。如果p-value的分布比较发散,可能是有批次效应或有其它blocking factor没有在设计矩阵中考虑进去。需要尝试在设计矩阵中增加可能的批次因子或blocking factor再重复执行上述分析。如果仍然没有解决,应用于多重假设的经验贝叶斯/ null estimation methods可能会有帮助。(If this does not help, empirical Bayes / null estimation methods for multiple testing are useful.)
table_CD <- topTable(palmieri_fit_CD, number = Inf)
head(table_CD)

hist(table_CD$P.Value, col = brewer.pal(3, name = "Set2")[1],
     main = "inflamed vs non-inflamed - Crohn's disease", xlab = "p-values")
table_UC <- topTable(palmieri_fit_UC, number = Inf)
head(table_UC)

hist(table_UC$P.Value, col = brewer.pal(3, name = "Set2")[2],
     main = "inflamed vs non-inflamed - Ulcerative colitis", xlab = "p-values")
多重假设检验校正
在原文中,p-value<0.001是显著性筛选标准,使用这个标准,UC疾病中获得947差异表达基因。
nrow(subset(table_UC, P.Value < 0.001))

## [1] 947
然而,这个列表中很难界定哪些是假阳性结果。采用p-value,我们可以说至多有 21041 (total number of tests) * 0.001 = 21.041 假阳性基因。那么在我们鉴定的差异基因列表中,有最多 2.22% 的基因可能是假阳性。
因此,如果同时做了特别多比较,采用原始的p-values作为筛选标准就有些宽松了,需要做多重假设检验校正。分子生物学中最流行的校正方式是假阳性率 (false discovery rate, FDR)。 采用简单的p-value阈值获得的差异基因列表的FDR可能会比较高。
另一方面,在p-value分布直方图中有一个差异基因构成的明显的峰。因此我们期待我们的差异基因列表中FDR比较低。
tail(subset(table_UC, P.Value < 0.001))
原始p-value 0.001校正后是0.0222, 与我们上面根据p-value估算出的FDR一致。(原文说有一个量级的差异,没看出来:The adjusted p-value for a raw p-value of 0.001 in the table is 0.0222, which is an order of magnitude lower than the FDR we can infer from p-values alone.)
这里为了与原文一致,还是继续使用p-value<0.001作为筛选标准。自己分析时,需要根据adj.P.Val进行筛选。
原文的结果可以从http://links.lww.com/IBD/A795获得并存储在当前目录的palmieri_DE_res.xlsx文件中。原始文章虽然使用p-value进行的筛选,但结果中也包含了FDR值。(生信宝典:这个地方实际是不推荐用Excel查看或存储结果的,具体见Excel改变了你的基因名,30% 相关Nature文章受影响,NCBI也受波及。)
#fpath <- system.file("extdata", "palmieri_DE_res.xlsx", package = "maEndToEnd")
fpath <- "palmieri_DE_res.xlsx"
palmieri_DE_res <- sapply(1:4, function(i) openxlsx::read.xlsx(fpath, cols = 1, sheet = i, startRow = 4))

names(palmieri_DE_res) <- c("CD_UP", "CD_DOWN", "UC_UP", "UC_DOWN")
palmieri_DE_res <- lapply(palmieri_DE_res, as.character)
paper_DE_genes_CD <- Reduce("c", palmieri_DE_res[1:2])
paper_DE_genes_UC <- Reduce("c", palmieri_DE_res[3:4])

overlap_CD <- length(intersect(subset(table_CD, P.Value < 0.001)$SYMBOL,
                               paper_DE_genes_CD)) / length(paper_DE_genes_CD)

overlap_UC <- length(intersect(subset(table_UC, P.Value < 0.001)$SYMBOL,
                               paper_DE_genes_UC)) / length(paper_DE_genes_UC)
overlap_CD

## [1] 0.6443

overlap_UC

## [1] 0.6731

total_genenumber_CD <- length(subset(table_CD, P.Value < 0.001)$SYMBOL)
total_genenumber_UC <- length(subset(table_UC, P.Value < 0.001)$SYMBOL)

total_genenumber_CD

## [1] 576

total_genenumber_UC

## [1] 947
绘制Venn图,拷贝all_de_for_venn.txt中的数据到www.ehbio.com/ImageGP,按图示选择,即可获得Venn图。
allList <- rbind(cbind(list=paper_DE_genes_CD, type="paper_DE_genes_CD"),
                 cbind(list=paper_DE_genes_UC, type="paper_DE_genes_UC"),
                 cbind(list=subset(table_CD, P.Value < 0.001)$SYMBOL, type="our_DE_genes_CD"),
                 cbind(list=subset(table_UC, P.Value < 0.001)$SYMBOL, type="our_DE_genes_UC"))
head(allList)

##      list       type
## [1,] "SEC61B"   "paper_DE_genes_CD"
## [2,] "PRKD1"    "paper_DE_genes_CD"
## [3,] "AVPR1A"   "paper_DE_genes_CD"
## [4,] "VTRNA1-3" "paper_DE_genes_CD"
## [5,] "LGALS1"   "paper_DE_genes_CD"
## [6,] "FKBP14"   "paper_DE_genes_CD"

write.table(allList,"all_de_for_venn.txt",sep="\t", row.names=F, col.names=F, quote=F)
我们在CD中找到576差异基因 (原文是298),在UC中找到947差异基因 (原文是520)。二者之间的吻合度还是比较好的,CD中共有差异基因比例0.6443,UC中共有差异基因比例0.6731。我们鉴定出更多的差异基因可能是因为考虑到个体作为blocking factor和使用limma做了方差校正。
火山图可视化差异基因
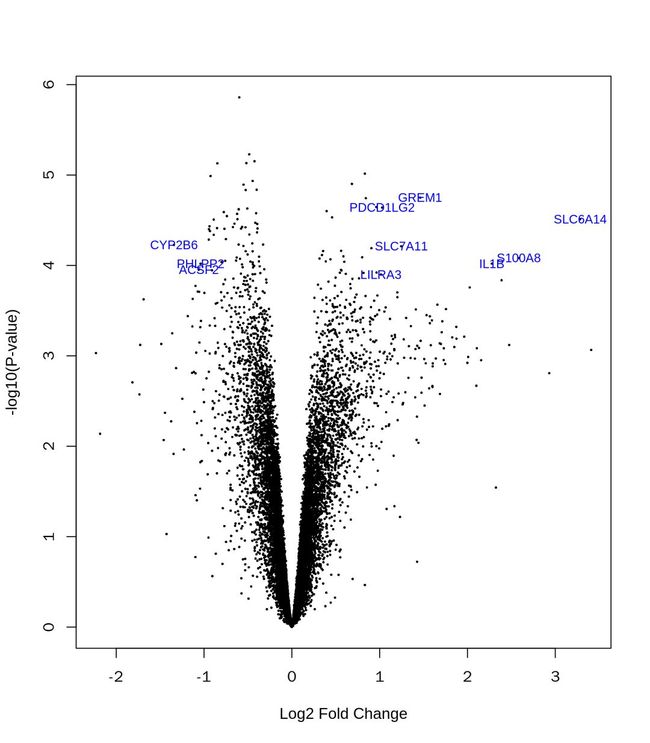
为了更好的可视化效果,只在火山图标注差异倍数大于1的p-value值最小的100个基因的名字。
volcano_names <- ifelse(abs(palmieri_fit_CD$coefficients)>=1,
                        palmieri_fit_CD$genes$SYMBOL, NA)

limma::volcanoplot(palmieri_fit_CD, coef = 1L, style = "p-value", highlight = 100,
            names = volcano_names,
            xlab = "Log2 Fold Change", ylab = NULL, pch=16, cex=0.35)
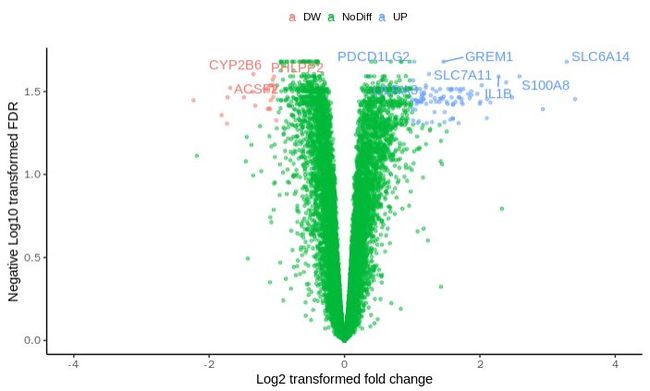
输出差异分析数据,自己绘制火山图
library(ggrepel)
res_output <- table_CD

res_output$level <- ifelse(res_output$adj.P.Val<=0.05, ifelse(res_output$logFC>=1, "UP", ifelse(res_output$logFC<=1*(-1), "DW", "NoDiff")) , "NoDiff")

res_output <- res_output[order(res_output$P.Value),]

top100_p <- res_output$P.Value[100]

res_output$ID <- ifelse((res_output$SYMBOL %in% volcano_names) & (res_output$P.Value5, 5.005)

boundary = ceiling(max(abs(res_output$logFC)))
p = ggplot(res_output, aes(x=logFC,y=padj,color=level)) +
  #geom_point(aes(size=baseMean), alpha=0.5) + theme_classic() +
  geom_point(size=1, alpha=0.5) + theme_classic() +
  xlab("Log2 transformed fold change") + ylab("Negative Log10 transformed FDR") +
  xlim(-1 * boundary, boundary) + theme(legend.position="top", legend.title=element_blank()) +
  geom_text_repel(aes(label=ID))
#ggsave(p, filename=paste0(file_base1,".volcano.pdf"),width=13.5,height=15,units=c("cm"))
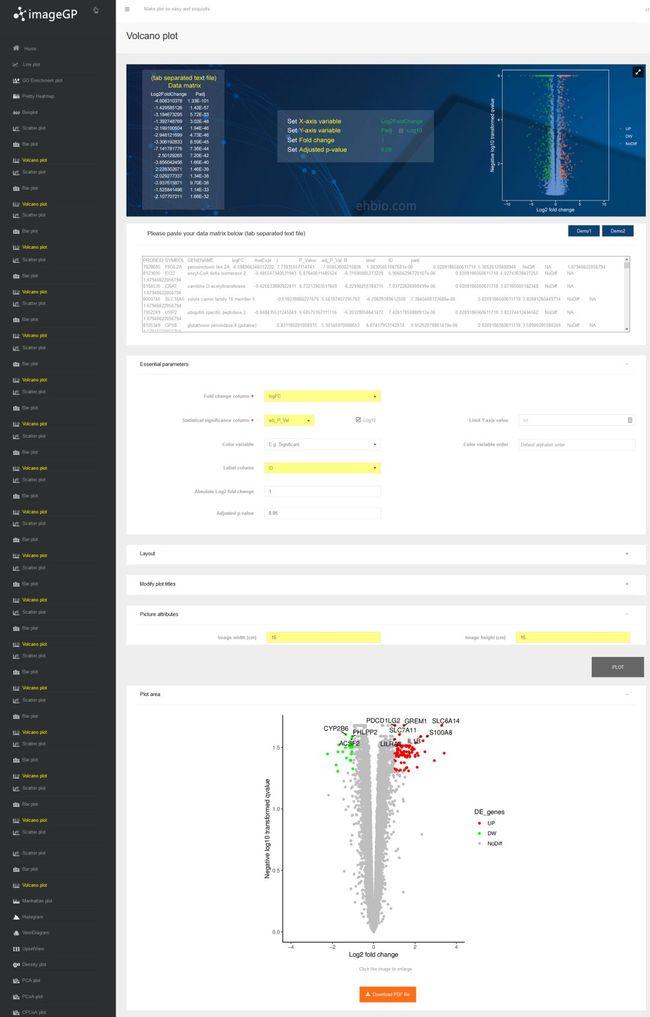
导出结果,用ImageGP (www.ehbio.com/ImageGP)绘图
colnames(res_output) <- str_replace_all(colnames(res_output), '[ .][ .]*', '_')
write.table(res_output, "for_volcano.txt", row.names=F, sep="\t", quote=F)
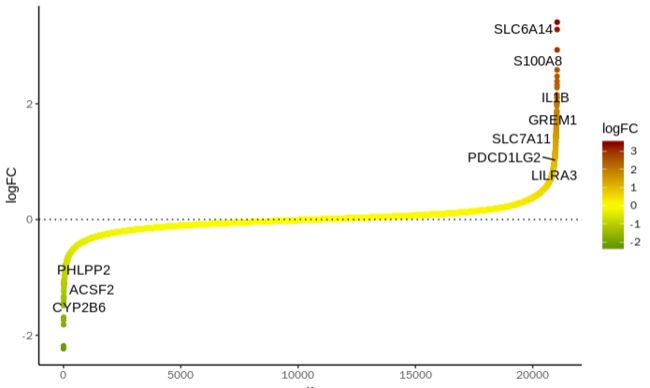
根据log2FolcChange排序基因
#head(res_output)
# 整理数据,按差异倍数排序,增加横轴,选择log2差异倍数大于5的标记基因名字
res_output_line <- res_output[order(res_output$logFC),]
res_output_line$x <- 1:nrow(res_output_line)
res_output_line$ID <- ifelse((res_output_line$SYMBOL %in% volcano_names) & (res_output_line$P.Value我们可以对这些标记的基因做些功能然所,如上调基因S100A8,在genecards.org中搜索后发现是一个pro-inflammatory complex的成员。
更多基于基因的分析见
科研小萌新,掌握这些技巧,轻松玩转各个基因!
生信宝典之傻瓜式 (二) 如何快速查找指定基因的调控网络
生信宝典之傻瓜式 (三) 我的基因在哪里发光 - 如何查找基因在发表研究中的表达
生信宝典之傻瓜式 (四) 蛋白蛋白互作网络在线搜索
生信宝典之傻瓜式 (五) 文献挖掘查找指定基因调控网络
生信宝典之傻瓜式 (六) 查找转录因子的靶基因
基因富集分析
基本原理见:
GO、GSEA富集分析一网打进
GSEA富集分析 - 界面操作
无需写代码的高颜值富集分析神器
去东方,最好用的在线GO富集分析工具
没钱买KEGG怎么办?REACTOME开源通路更强大
超简便的国产lncRNA预测工具LGC
我想做信号通路分析,但我就是不想学编程
如前所述,一般推荐使用FDR(也称adj.P.Val)作为筛选差异基因的阈值,可以更好的估计假阳性率和比较解释结果。在后续富集分析中,我们使用FDR<0.1作为筛选标准。
DE_genes_CD <- subset(table_CD, adj.P.Val < 0.1)$PROBEID
选择合适的背景基因集
这里我们使用genefilter::genefinder筛选与差异基因表达模式分布相近的一批背景基因集以免因为表达值的筛选对后续的富集分析进行误导 (差异基因是表达的基因的一部分,严格来讲用全部注释基因集做背景注释集不太妥当)。这个方法于GOrilla的算法类似。
对每个差异表达的基因,使用genefinder函数鉴定与其有相似表达的基因。genefinder函数返回一个列表有两个元素:背景基因的索引和背景基因与差异基因表达分布的距离度量。
back_genes_idx <- genefilter::genefinder(palmieri_final,
                                        as.character(DE_genes_CD),
                                        method = "manhattan", scale = "none")

# 提取背景基因的PROBIDs
back_genes_idx <- sapply(back_genes_idx, function(x)x$indices)
head(back_genes_idx)

##      7928695 8123695 8164535 8009746 7952249 8105348 8018558 8007008 8072876
##      8162586 7935180 8084589 7982377 8091411 8081890 8154245 8040362 7993126
##      7982878 8120927 7956009 7907859 7901549 8008263 8138834 8169504 7901140
# 提取背景基因
back_genes <- featureNames(palmieri_final)[back_genes_idx]

# 从中扣除差异基因
back_genes <- setdiff(back_genes, DE_genes_CD)

# 验证扣除结果,应该为空
intersect(back_genes, DE_genes_CD)

## character(0)

length(back_genes)

## [1] 9756
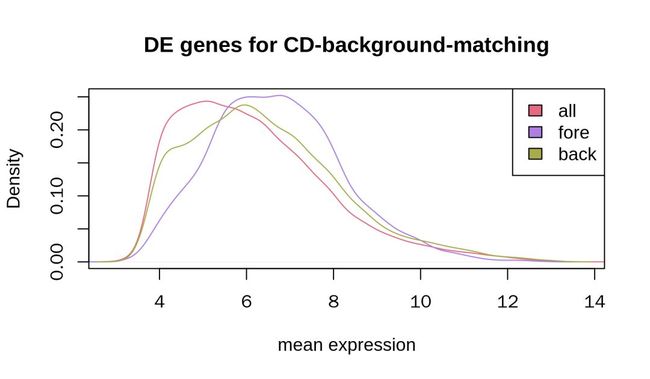
绘制所有基因、差异基因和背景基因的表达分布密度曲线,以看其表达分布模式是否相近,对后续的富集分析是否有影响。整体分布模式相仿,只是差异基因 (fore,紫色的线)有些向右偏移,说明鉴定出的差异基因整体表达较高,在背景基因集中难找到类似的分布。
multidensity(list(
        all = table_CD[,"AveExpr"] ,
        fore = table_CD[DE_genes_CD , "AveExpr"],
        back = table_CD[rownames(table_CD) %in% back_genes, "AveExpr"]),
        col = c("#e46981", "#ae7ee2", "#a7ad4a"),
     xlab = "mean expression",
   main = "DE genes for CD-background-matching")
我们采用topGO包进行富集分析,其优势是会考虑GO的层级结构,只输出最特异的基因集。
运行topGO
获取差异基因和与其表达模式相近的背景基因, 定义一个有名字的列表,同时包含差异基因 (level 1)和背景基因(level 0)作为topGO的一个基因列表输入。
gene_IDs <- rownames(table_CD)
# 获取差异基因和与其表达模式相近的背景基因
in_universe <- gene_IDs %in% c(DE_genes_CD, back_genes)
in_selection <- gene_IDs %in% DE_genes_CD

# 定义一个有名字的列表,同时包含差异基因和背景基因
all_genes <- factor(as.integer(in_selection[in_universe]))
names(all_genes) <- gene_IDs[in_universe]

# 差异基因为1,背景基因为0
head(all_genes)
# 7928695 8123695 8164535 8009746 7952249 8105348
#      1       1       1       1       1       1
# Levels: 0 1

table(all_genes)
# all_genes
#   0    1
# 9756 2490
初始化topGO数据集,注释数据来源于所用的芯片。 nodeSize参数设置GO term中允许的最小基因数,少于这个数目的注释不用于后续分析。
top_GO_data <- new("topGOdata", ontology = "BP", allGenes = all_genes,
      nodeSize = 10, annot = annFUN.db, affyLib = "hugene10sttranscriptcluster.db")
这里应用 topGO的两个算法进行富集测试,常规的Fisher检验和elim算法。elim算法考虑GO的层级结构致力于富集最特异的条目。这是一个自底向上的富集方式,先对最特异的通路进行富集分析,如果显著,分析其上一层注释时去除这部分基因,以此类推。
result_top_GO_elim <-
       runTest(top_GO_data, algorithm = "elim", statistic = "Fisher")
result_top_GO_classic <-
       runTest(top_GO_data, algorithm = "classic", statistic = "Fisher")
筛选top 100富集的通路,显著富集的通路 raw p-value == 2,不显著富集的通路 raw p-value == 1。
res_top_GO <- GenTable(top_GO_data, Fisher.elim = result_top_GO_elim,
        Fisher.classic = result_top_GO_classic,
        orderBy = "Fisher.elim" , topNodes = 100)

genes_top_GO <- printGenes(top_GO_data, whichTerms = res_top_GO$GO.ID,
    chip = "hugene10sttranscriptcluster.db", geneCutOff = 1000)

res_top_GO$sig_genes <- sapply(genes_top_GO, function(x){
                str_c(paste0(x[x$'raw p-value' == 2, "Symbol.id"],";"),
                      collapse = "")
    })

# Annotated: 背景基因集中term总注释基因
# Significant: 差异基因落在term中的数目
# Expected: 期望的差异基因落在term中的数目
# Rank in Fisher.classic:按Fisher.classic pvalue排序
# Fisher.elim Fisher.classic:富集p-value (未做multiple test adjust)
head(res_top_GO)

# 替换下列名字,不含空格等特殊字符

colnames(res_top_GO) <- str_replace_all(colnames(res_top_GO), '[ .][ .]*', '_')

write.table(res_top_GO[1:10,], "top10_enriched_go.txt", row.names=F, sep="\t", quote=F)
富集分析表格结果
GO_ID    Term    Annotated    Significant    Expected    Rank_in_Fisher_classic    Fisher_elim    Fisher_classic    sig_genes
GO:0030593    neutrophil chemotaxis    61    39    13.4    68    1.9e-10    2.0e-12    PIK3CD;PDE4B;S100A9;FCER1G;TGFB2;CSF3R;S100A8;NCKAP1L;C3AR1;LGALS3;DAPK2;CCL22;CX3CL1;CCL2;CCL18;CCL3;CCR7;VAV1;C5AR1;DYSF;IL1RN;CXCR2;IL1B;CXCR1;CXADR;ITGB2;RAC2;CXCL8;CXCL6;CXCL1;CXCL13;CXCL5;CXCL3;CXCL2;CXCL9;CXCL10;CXCL11;RIPOR2;PIK3CG;
GO:0051897    positive regulation of protein kinase B ...    107    53    23.51    104    2.6e-10    2.6e-10    PIK3CD;F3;CHI3L1;TCF7L2;PIK3AP1;FGFR2;ERBB3;P2RX4;KITLG;FGF7;CD19;CX3CL1;ERBB2;CSF3;MIR21;PIK3R5;CCL3;CCR7;VAV1;MYDGF;INSR;ITGB1BP1;IGFBP5;IRS1;ITSN1;OSM;CD86;CX3CR1;CD80;PIK3CB;PIK3R1;SEMA5A;PDGFRB;GCNT2;TNF;RAMP3;EGFR;PIK3CG;HGF;NRG1;BAG4;FGFR1;ARFGEF1;ANGPT1;PTK2;TEK;TGFBR1;MYORG;ENG;MIR221;TNF;TNF;GPX1;
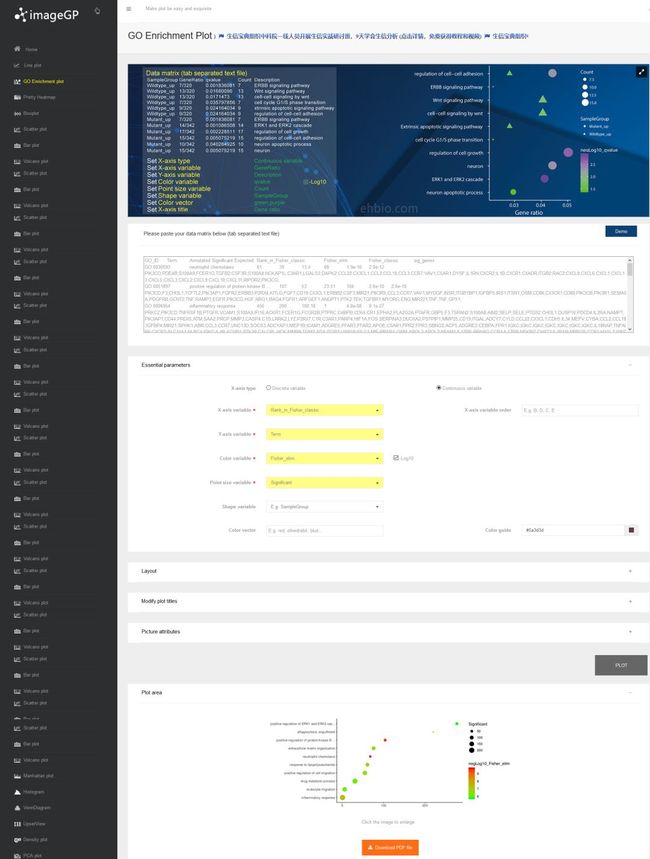
可视化GO富集分析结果
上一步输出的文件top10_enriched_go.txt,导入高颜值免费在线绘图网站 (www.ehbio.com/ImageGP

