整个项目地址如下:
https://github.com/New-generation-hsc/MechineLearning
目录
- 决策树模型
概念
适用范围 - 特征选择
最优特征 - 决策树生成算法
ID3 算法
C4.5 算法
CART 算法 - 决策树的减枝
预减枝
后减枝 - Matplotlib 绘画决策树
- scikit-learn 运用决策树
- 运用决策树预测隐形眼镜类型
决策树模型
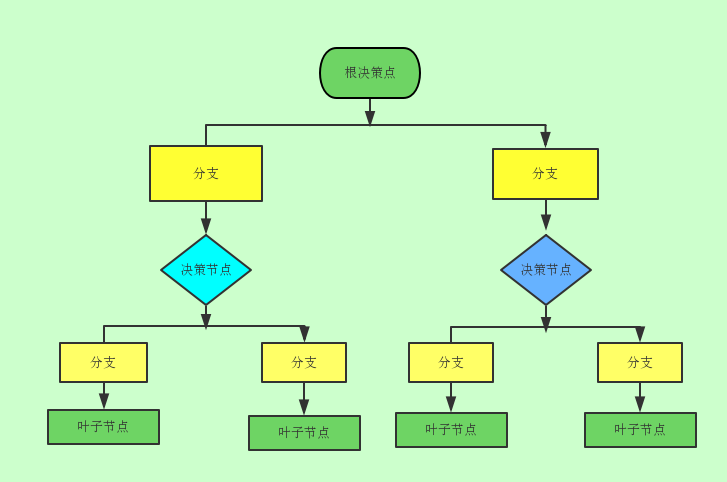
决策树是一个预测模型,他表示对象属性和对象属性值之间的一种映射,树中的每一个节点表示对象属性的判断条件,其分支表示符合节点条件的对象。树的叶子节点表示对象所属的预测结果。
适用范围
- 适用于对不确定性投资方案期望收益的定量分析
- 无法适用于一些不能用数量表示的决策
- 对各种方案的出现概率的确定性有时主观性较大,导致决策失误
特征选择
信息增益
在信息论中,熵是接收的每条消息中包含的信息的平均量,又称为 信息熵,平均信息量 。 熵最好理解为不确定性的量度而不是确定性的量度,因为越随机的新源的上越大。
事件的概率分布和每个事件的信息量构成了一个随机变量,这个随机变量的均值,就是这个分布产生的信息量的平均值(即熵)。
依据 Boltzman's H-theorem , 香农把随机变量X的熵值H定义如下:
其中,P是X的概率质量分布函数
当取自有限样本时,
而I(x)是X的信息量(又称自信息)
例如:英语中有26个字母,假设每个字母在文章中出现次数平均的话,每个字母的信息量为:
条件熵H(Y|X)表示在已知随机变量X的条件下,随机变量Y的不确定性。随机变量X给定的条件随机变量Y的条件熵H(Y|X)定义为X给定条件下Y的条件概率分布对X的数学期望。
如果H(Y|X)为变数X取特定值x的条件下的熵,那么H(Y|X)就是H(Y|X=x)在X取遍所有可能的x后取平均值的后果。
信息增益
特征A对训练数据集D的信息增益g(D, A), 定义为集合D的经验熵H(D)与特征A给定条件下D的经验条件熵H(D|A)之差,即
信息增益是针对一个一个的特征而言的,就是看一个特征t,系统有它和没有它的时候信息量各是多少,两者的差值就是这个特征给系统带来的信息量即,增益。
信息增益大的特征具有更强的分类能力
信息增益的算法:
    输入:训练数据集D和特征A;
    输出:特征A对训练数据集D的信息增益g(D|A)
(1) 计算数据集的经验熵H(D)
其中K, 表示数据集D共可以分为K类
(2)计算特征A对数据集D的经验条件熵H(D|A)
(3)计算信息增益
决策树的生成算法
ID3算法
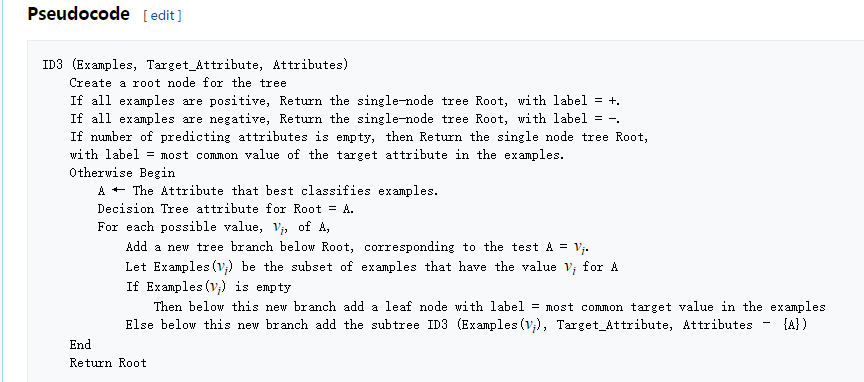
ID3是一种自顶向下增长树的贪婪算法,在每个结点选取能最好分类的样例属性。继续这个过程直到这棵树完美分类训练样例,或所有样例的属性全部都用过了。
信息增益比
特征A对训练数据集D的信息增益比定义为其信息增益g(D,A)与训练数据集D关于特征A的值的熵H(D)之比,即
其中,
n 是特征A取值的个数。
分类回归树(CART)
CART假设决策树是二叉树,内部节点特征的取值为“是”和“否”, 左分支是取值为“是”的分支,右分支是取值为“否”的分支,这样的决策树等价于递归地二分每个特征。
分类树用基尼指数选择最优特征,同时决定该特征的最优二分切分点
(基尼指数) 分类问题中,假设有K个类,样本点属于第k个类的概率为p, 则概率分布的基尼指数定义为:
对于二类分类问题,若样本点属于第一类的概率为p,则概率分布的基尼指数为:
对于给定的样本集合D,其基尼指数为:
这里,Ck是D中属于第k类的样本子集,K是类的个数。
如果样本集合D根据特征A是否取某一可能值a被分割成D1和D2两部分,即:
则在特征A的条件下,集合D的基尼指数定义为:
基尼指数Gini(D,A)表示A=a分割后集合D的不确定性。
代码示例
计算香农熵代码:
def entropy(attribute_data):
    """
    Calculate Shannon entropy
    we can use np.unique function and set the `return_counts` True
    :param attribute_data: type:[np.array]-> data from a single feature
    """
    _, frequences = np.unique(attribute_data, return_counts=True)

    # calculate the probility of every unique value
    val_prob = frequences / len(attribute_data)
    return -val_prob.dot(np.log2(val_prob))
在此处运用了numpy库,快速的计算列表中每个元素的频率,最后运用向量点乘计算熵
计算信息增益代码:
def info_gain(attribute_data, labels):
    """
    Caculate information gain
    :param attribute_data: type:[np.array]-> data from a single feature
    """
    attr_value_counts = get_count_dict(attribute_data)
    total_count = len(labels)

    EA = 0.0
    for attr_val, attr_value_count in attr_value_counts.items():
        EA += attr_value_count*entropy(labels[attribute_data == attr_val])

    return entropy(labels) - EA / total_count


def get_count_dict(attribute_data):
    """
    return a dict where the key is unique value, the value is frequency
    :param attribute_data: type:[np.array]-> data from a single feature
    """
    values, frequences = np.unique(attribute_data, return_counts=True)
    return dict(zip(values, frequences))
在这里贴上两个构建决策树的代码,他们两的本质都是一样,运用ID3 算法:
def create_decision_tree(self, dataset, labels, attributes):

        default = Counter(labels).most_common(1)[0][1]
        # Counter return a list (element, frequency)

        """If the dataset is empty or the attribute list is empty, return
        the default value."""
        if not dataset or len(labels) < 1:
            return default
        elif labels.count(labels[0]) == len(labels):
            return labels[0]
        else:
            # Choose the next best attribute to best classify our data
            best = self.choose_attribute(dataset, labels, attributes)

            # Create a new decision tree/node with the best attribute
            tree = {best:{}}

            # Create a subtree for the current value under the "best" field
            for data in self.get_values(dataset, best):
                sub_dataset, sub_labels = self.get_examples(dataset, labels, best, data)
                subtree = self.create_decision_tree(
                                sub_dataset, sub_labels,
                                [attr for attr in attributes if attr != best]
                                )
                tree[best][data] = subtree
        return tree
此示例代码参照《机器学习实战》
def build(self, dataset, labels, attributes):
        """
        build a subtree
        """
        self.choose_best_attribute(dataset, labels, attributes)

        best_attribute_column = attributes.index(self.attribute)
        attribute_data = dataset[:, best_attribute_column]

        child_attributes = attributes[:]
        child_attributes.remove(self.attribute)

        self.children = []
        for val in np.unique(attribute_data):
            child_data = np.delete(dataset[attribute_data == val, :], best_attribute_column, 1)
            child_labels = labels[attribute_data == val]
            self.children.append(DecisionTree(child_data, child_labels, child_attributes, value=val, parent=self))
此示例代码参照网上代码,传送门在文章末尾。
决策树的绘画
- 绘图的原理
文本节点 + 箭头 + 分支条件
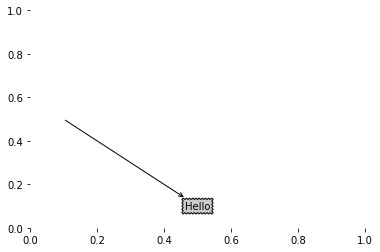
其中, 文本节点和箭头可以使用 matplotlib 库中的 annonate 来实现。例如下面一个简单的例子:
def plot_node(self, nodeText, curent_pos, parent_pos, nodeType):
        """
        Arguments:
            nodeText {str} -- [the text in the node]
            curent_pos {tuple} -- [current node position]
            parent_pos {tuple} -- [parent node position]
        """
        self.axes.annotate(nodeText, xy=parent_pos, xycoords='axes fraction', \
                xytext=curent_pos, textcoords='axes fraction', va='center', \
                ha='center', bbox=nodeType, arrowprops=ARROW_ARGS)
绘制文本节点 + 箭头
绘画分支的代码如下:
def plot_branch_text(self, current_pos, parent_pos, text):

        x_mid = (parent_pos[0] - current_pos[0])/2 + current_pos[0]
        y_mid = (parent_pos[1] - current_pos[0])/2 + current_pos[1]
        self.axes.text(x_mid, y_mid, text)
绘制决策树的关键代码如下:
def plot(self, tree, parent_pos, nodeText):
        """The main function of this class, plot every node, and branch recursively"""

        num_leafs = self.get_leafs(tree)
        depth = self.get_depth(tree)
        node = list(tree.keys())[0]

        current_pos = (self.xOff + (1.0 + num_leafs)/2.0/self.width, self.yOff)
        # plot the branch text
        self.plot_branch_text(current_pos, parent_pos, nodeText)

        # plot the decision node
        self.plot_node(node, current_pos, parent_pos, DECISION_NODE)

        branch = tree[node]
        self.yOff = self.yOff - 1.0 / self.hegiht
        for key in branch.keys():
            if isinstance(branch[key], dict):
                self.plot(branch[key], current_pos, str(key))
            else:
                self.xOff = self.xOff + 1.0 / self.width
                self.plot_node(branch[key], (self.xOff, self.yOff), current_pos, LEAF_NODE)
                self.plot_branch_text((self.xOff, self.yOff), current_pos, str(key))
        self.yOff = self.yOff + 1.0 / self.hegiht
对于如下这棵树:
{'no surfacing': {0: 'no', 1: {'flippers': {0:'no', 1:'yes'}}}}
效果如下:
实战环节
数据来源与《机器学习实战》
数据格式如下:
young   myope   no  reduced no lenses
young   myope   no  normal  soft
young   myope   yes reduced no lenses
young   myope   yes normal  hard
young   hyper   no  reduced no lenses
young   hyper   no  normal  soft
young   hyper   yes reduced no lenses
young   hyper   yes normal  hard
pre myope   no  reduced no lenses
pre myope   no  normal  soft
pre myope   yes reduced no lenses
pre myope   yes normal  hard
pre hyper   no  reduced no lenses
pre hyper   no  normal  soft
pre hyper   yes reduced no lenses
pre hyper   yes normal  no lenses
presbyopic  myope   no  reduced no lenses
presbyopic  myope   no  normal  no lenses
presbyopic  myope   yes reduced no lenses
presbyopic  myope   yes normal  hard
presbyopic  hyper   no  reduced no lenses
presbyopic  hyper   no  normal  soft
presbyopic  hyper   yes reduced no lenses
presbyopic  hyper   yes normal  no lenses
生成的树如下:
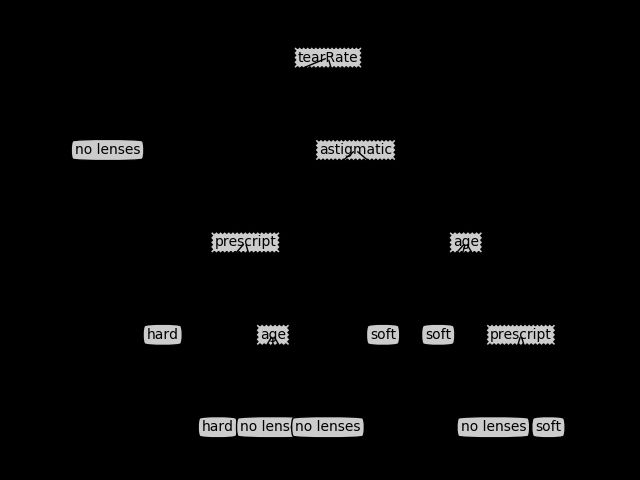
{'tearRate': {'reduced': 'no lenses', 'normal': {'astigmatic': {'no': {'age': {'presbyopic': {'prescript': {'hyper': 'soft', 'myope': 'no lenses'}}, 'young': 'soft', 'pre': 'soft'}}, 'yes': {'prescript': {'hyper': {'age': {'presbyopic': 'no lenses', 'young': 'hard', 'pre': 'no lenses'}}, 'myope': 'hard'}}}}}}
决策树的效果图如下:
末尾
花了几天的时间去整理决策树的内容,慢慢地去理解熵,信息增益,基尼指数的含义,用心去写好这篇文章,当然其中也有一些内容没写到这上面,如果想知道可以私信我哦。都看到这里了,何不点个赞再走呢?
引用
- 《机器学习实战》
- 《统计学习方法》,李航
- 《机器学习》,周志华
- Building Decision Trees in Python
- dtree_bias_var
- CART分类回归算法


