
deepTools
deepTools 是一套基于python开发的工具,适用于有效处理分析高通量测序数据,可用于ChIP-seq, RNA-seq 或 MNase-seq。
#1. deepTools 系列工具

deepTools workflow
##1.1 deepTools 系列工具信息汇总
| tool | type | input files | main output file(s) | application |
|---|---|---|---|---|
| multiBamSummary | data integration | 2 or more BAM | interval-based table of values | perform cross-sample analyses of read counts –> plotCorrelation, plotPCA |
| multiBigwigSummary | data integration | 2 or more bigWig | interval-based table of values | perform cross-sample analyses of genome-wide scores –> plotCorrelation, plotPCA |
| plotCorrelation | visualization | bam/multiBigwigSummary output | clustered heatmap | visualize the Pearson/Spearman correlation |
| plotPCA | visualization | bam/multiBigwigSummary output | 2 PCA plots | visualize the principal component analysis |
| plotFingerprint | QC | 2 BAM | 1 diagnostic plot | assess enrichment strength of a ChIP sample |
| computeGCBias | QC | 1 BAM | 2 diagnostic plots | calculate the exp. and obs. GC distribution of reads |
| correctGCBias | QC | 1 BAM, output from computeGCbias | 1 GC-corrected BAM | obtain a BAM file with reads distributed according to the genome’s GC content |
| bamCoverage | normalization | BAM | bedGraph or bigWig | obtain the normalized read coverage of a single BAM file |
| bamCompare | normalization | 2 BAM | bedGraph or bigWig | normalize 2 files to each other (e.g. log2ratio, difference) |
| computeMatrix | data integration | 1 or more bigWig, 1 or more BED | zipped file for plotHeatmap or plotProfile | compute the values needed for heatmaps and summary plots |
| estimateReadFiltering | information | 1 or more BAM files | table of values | estimate the number of reads filtered from a BAM file or files |
| alignmentSieve | QC | 1 BAM file | 1 filtered BAM or BEDPE file | filters a BAM file based on one or more criteria |
| plotHeatmap | visualization | computeMatrix output | heatmap of read coverages | visualize the read coverages for genomic regions |
| plotProfile | visualization | computeMatrix output | summary plot (“meta-profile”) | visualize the average read coverages over a group of genomic regions |
| plotCoverage | visualization | 1 or more BAM | 2 diagnostic plots | visualize the average read coverages over sampled genomic positions |
| bamPEFragmentSize | information | 1 BAM | text with paired-end fragment length | obtain the average fragment length from paired ends |
| plotEnrichment | visualization | 1 or more BAM and 1 or more BED/GTF | A diagnostic plot | plots the fraction of alignments overlapping the given features |
| computeMatrixOperations | miscellaneous | 1 or more BAM and 1 or more BED/GTF | A diagnostic plot | plots the fraction of alignments overlapping the given features |
##1.2 BAM 和bigWig文件处理工具
- multiBamSummary
利用两个或多个bam文件计算基因组区段reads覆盖度;BED-file 指定基因组区域,bins模式可用于全基因组范围分析;产生的结果(.npz)可用于plotCorrelation进行相关性分析和用于plotPCA进行主成分分析。
$ deepTools2.0/bin/multiBamSummary bins \
 --bamfiles testFiles/*bam \ # using all BAM files in the folder
 --minMappingQuality 30 \
 --region 19 \ # limiting the binning of the genome to chromosome 19
 --labels H3K27me3 H3K4me1 H3K4me3 HeK9me3 input \
 -out readCounts.npz --outRawCounts readCounts.tab

 $ head readCounts.tab
 #'chr'     'start' 'end'   'H3K27me3'      'H3K4me1'       'H3K4me3'       'HeK9me3'       'input'
 19 10000   20000   0.0     0.0     0.0     0.0     0.0
 19 20000   30000   0.0     0.0     0.0     0.0     0.0
 19 30000   40000   0.0     0.0     0.0     0.0     0.0
 19 40000   50000   0.0     0.0     0.0     0.0     0.0
 19 50000   60000   0.0     0.0     0.0     0.0     0.0
 19 60000   70000   1.0     1.0     0.0     0.0     1.0
 19 70000   80000   0.0     1.0     7.0     0.0     1.0
 19 80000   90000   15.0    0.0     0.0     6.0     4.0
 19 90000   100000  73.0    7.0     4.0     16.0    5.0
multiBigwigSummary
与multiBamSummary相比,输入文件格式是bigWig 。correctGCBias
矫正GC-bias;-
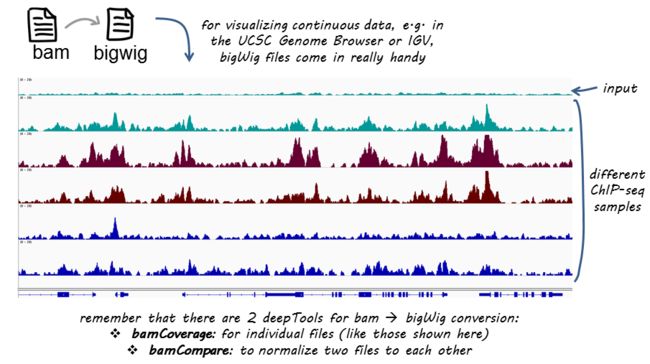
bamCoverage
 norm_IGVsnapshot_indFiles
bamCoverage 利用测序数据比对结果转换为基因组区域reads覆盖度结果。可以自行设定覆盖度计算的窗口大小(bin);bamCoverage 内置了各种标准化方法:scaling factor, Reads Per Kilobase per Million mapped reads (RPKM), counts per million (CPM), bins per million mapped reads (BPM) and 1x depth (reads per genome coverage, RPGC).
Example : bamCoverage 用于ChIPseq分析
bamCoverage --bam a.bam -o a.SeqDepthNorm.bw \
    --binSize 10
    --normalizeUsing RPGC
    --effectiveGenomeSize 2150570000
    --ignoreForNormalization chrX
    --extendReads
    --outFileFormat bedgraph
- bamCompare
两个BAM 文件相比较,计算二者之间窗口中的reads丰度比率。
usage: bamCompare -b1 treatment.bam -b2 control.bam -o log2ratio.bw
- bigwigCompare
- computeMatrix
给基因组区段打分,产生的文件可用于plotHeatmap和plotProfiles作图;基因组区段可以是基因或其他区域,使用BED格式文件定义即可。
computeMatrix 有两种不同的模式

computeMatrix two modes
-
reference-point(relative to a point): 计算某个点的信号丰度 -
scale-regions(over a set of regions): 把所有基因组区段缩放至同样大小,然后计算其信号丰度
如下命令查看帮助:
$ computeMatrix scale-regions –help
$ computeMatrix scale-regions -S  -R  -b 1000
$ computeMatrix reference-point –help
$ computeMatrix reference-point -S  -R  -a 3000 -b 3000
Example 1:单个输入文件 (reference-point mode)
$ computeMatrix reference-point \ # choose the mode
       --referencePoint TSS \ # alternatives: TSS, TES, center
       -b 3000 -a 10000 \ # define the region you are interested in
       -R testFiles/genes.bed \
       -S testFiles/log2ratio_H3K4Me3_chr19.bw  \
       --skipZeros \
       -o matrix1_H3K4me3_l2r_TSS.gz \ # to be used with plotHeatmap and plotProfile
       --outFileSortedRegions regions1_H3K4me3_l2r_genes.bed
注:point-BED文件指定基因组区段的起始位置
Example 2:多个输入文件 (scale-regions mode)
$ deepTools2.0/bin/computeMatrix scale-regions \
  -R genes_chr19_firstHalf.bed genes_chr19_secondHalf.bed \ # separate multiple files with spaces
  -S testFiles/log2ratio_*.bw  \ or use the wild card approach
  -b 3000 -a 3000 \
  --regionBodyLength 5000 \
  --skipZeros -o matrix2_multipleBW_l2r_twoGroups_scaled.gz \
  --outFileNameMatrix matrix2_multipleBW_l2r_twoGroups_scaled.tab \
  --outFileSortedRegions regions2_multipleBW_l2r_twoGroups_genes.bed
Note that the reported regions will have the same coordinates as the ones in
##1.3 质控工具
- plotCorrelation
基于multiBamSummary 或multiBigwigSummary结果计算样品间的相关性。并且还可以通过Scatterplot或Heatmap进行展示。
Example 1:Scatterplot
$ deepTools2.0/bin/plotCorrelation \
-in scores_per_transcript.npz \
--corMethod pearson --skipZeros \
--plotTitle "Pearson Correlation of Average Scores Per Transcript" \
--whatToPlot scatterplot \
-o scatterplot_PearsonCorr_bigwigScores.png   \
--outFileCorMatrix PearsonCorr_bigwigScores.tab
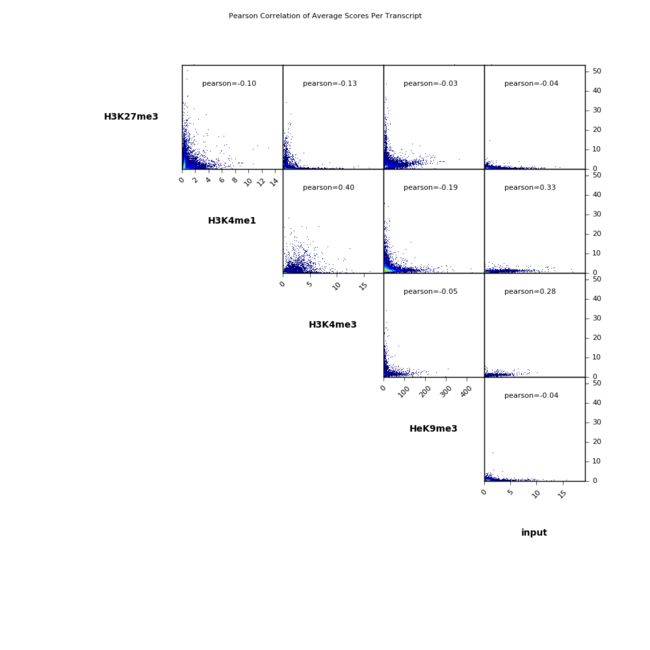
scatterplot_PearsonCorr_bigwigScores
Example 2:Heatmap
$ deepTools2.0/bin/plotCorrelation \
    -in readCounts.npz \
    --corMethod spearman --skipZeros \
    --plotTitle "Spearman Correlation of Read Counts" \
    --whatToPlot heatmap --colorMap RdYlBu --plotNumbers \
    -o heatmap_SpearmanCorr_readCounts.png   \
    --outFileCorMatrix SpearmanCorr_readCounts.tab

heatmap_SpearmanCorr_readCounts1
- plotPCA
基于multiBamSummary 或multiBigwigSummary结果进行主成分分析,并作出基于两个主成分的图和前五个特征代表性的图。
Example
$ deepTools2.0/bin/plotPCA -in readCounts.npz \
-o PCA_readCounts.png \
-T "PCA of read counts"

PCA_readCounts
- plotFingerprint
对样本比对结果reads累积情况进行展示。一定长度窗口(bin)上reads数进行计数,然后排序,再依次累加画图。input (能测到90%DNA片段)在基因组理论上是均匀分布,随着测序深度增加趋近于直线,实验组在排序越高的窗口处reads累积速度越快,说明这些区域富集的越特异。
 QC_fingerprint
Example
$ deepTools2.0/bin/plotFingerprint \
 -b testFiles/*bam \
--labels H3K27me3 H3K4me1 H3K4me3 H3K9me3 input \
--minMappingQuality 30 --skipZeros \
--region 19 --numberOfSamples 50000 \
-T "Fingerprints of different samples"  \
--plotFile fingerprints.png \
--outRawCounts fingerprints.tab

fingerprints1
- bam PEFragmentSize
计算bam文件中双端reads的fragment size长度。 - compute GCBias
计算GC-bias - plot Coverage
计算样品测序深度。随机抽取1 million bp ,计算reads数,统计碱基覆盖率和覆盖次数。
##1.4 热图和总结图
- plotHeatmap
Example 1: 根据computeMatrix结果画热图
# run compute matrix to collect the data needed for plotting
$ computeMatrix scale-regions -S H3K27Me3-input.bigWig \
                                 H3K4Me1-Input.bigWig  \
                                 H3K4Me3-Input.bigWig \
                              -R genes19.bed genesX.bed \
                              --beforeRegionStartLength 3000 \
                              --regionBodyLength 5000 \
                              --afterRegionStartLength 3000
                              --skipZeros -o matrix.mat.gz
$ plotHeatmap -m matrix.mat.gz \
      -out ExampleHeatmap1.png \
plot Heatmap
Example 2: plotHeatmap还可以进行聚类分析
$ plotHeatmap -m matrix_two_groups.gz \
     -out ExampleHeatmap2.png \
     --colorMap RdBu \
     --whatToShow 'heatmap and colorbar' \
     --zMin -3 --zMax 3 \
     --kmeans 4  #聚类参数
[图片上传失败...(image-d28547-1556115525034)]
其他参数
颜色自定义:--colorList 'black, yellow' 'white,blue' '#ffffff,orange,#000000'
去掉热图边框:--boxAroundHeatmaps no
- plotProfile
根据computeMatrix结果画图。
Example 1: 根据样本画图
# run compute matrix to collect the data needed for plotting
$ computeMatrix scale-regions -S H3K27Me3-input.bigWig \
                                 H3K4Me1-Input.bigWig  \
                                 H3K4Me3-Input.bigWig \
                              -R genes19.bed genesX.bed \
                              --beforeRegionStartLength 3000 \
                              --regionBodyLength 5000 \
                              --afterRegionStartLength 3000
                              --skipZeros -o matrix.mat.gz

$ plotProfile -m matrix.mat.gz \
              -out ExampleProfile1.png \
              --numPlotsPerRow 2 \
              --plotTitle "Test data profile"

Example Profile1
Example 2: 根据基因画图
$ plotProfile -m matrix.mat.gz \
     -out ExampleProfile2.png \
     --plotType=fill \ # add color between the x axis and the lines
     --perGroup \ # make one image per BED file instead of per bigWig file
     --colors red yellow blue \
     --plotTitle "Test data profile"

Example Profile2
Example 3: 聚类画图
$ plotProfile -m matrix.mat.gz \
      --perGroup \
      --kmeans 2 \
      -out ExampleProfile3.png
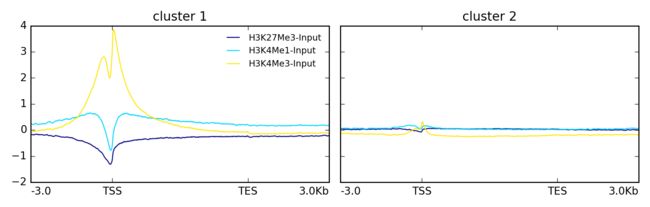
Example Profile3
Example 4: 画热图
$ plotProfile -m matrix.mat.gz \
      --perGroup \
      --kmeans 2 \
      -plotType heatmap \
      -out ExampleProfile3.png

Example Profile4
plotEnrichment
统计样本BED文件中peak或者GTF文件中feature 在chipseq结果中富集情况
Example
$ plotEnrichment -b Input.bam H3K4Me1.bam H3K4Me3.bam \
--BED up.bed down.bed \
--regionLabels "up regulated" "down regulated" \
-o enrichment.png
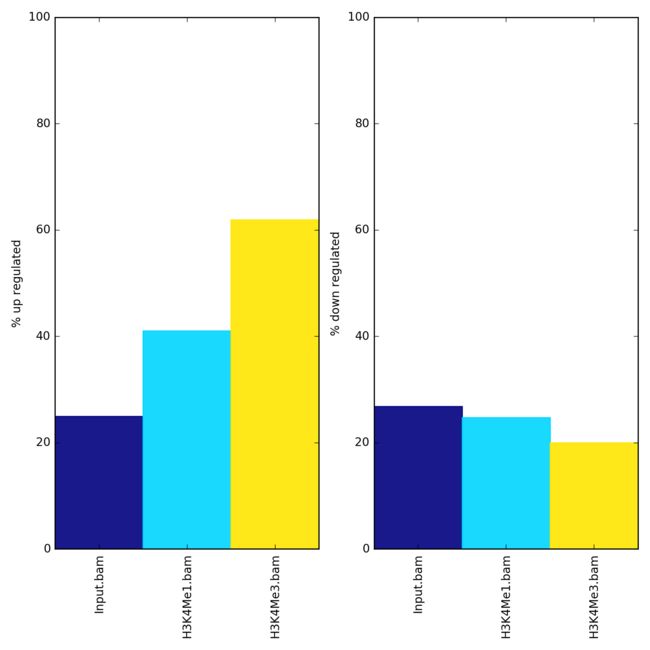
plot Enrichment
参考:
The tools of deeptools