分格显示
# View more python tutorials on my Youtube and Youku channel!!!

# Youtube video tutorial: https://www.youtube.com/channel/UCdyjiB5H8Pu7aDTNVXTTpcg
# Youku video tutorial: http://i.youku.com/pythontutorial

# 16 - grid
"""
Please note, this script is for python3+.
If you are using python2+, please modify it accordingly.
Tutorial reference:
http://matplotlib.org/users/gridspec.html
"""

import matplotlib.pyplot as plt
import matplotlib.gridspec as gridspec

# method 1: subplot2grid
##########################
plt.figure()
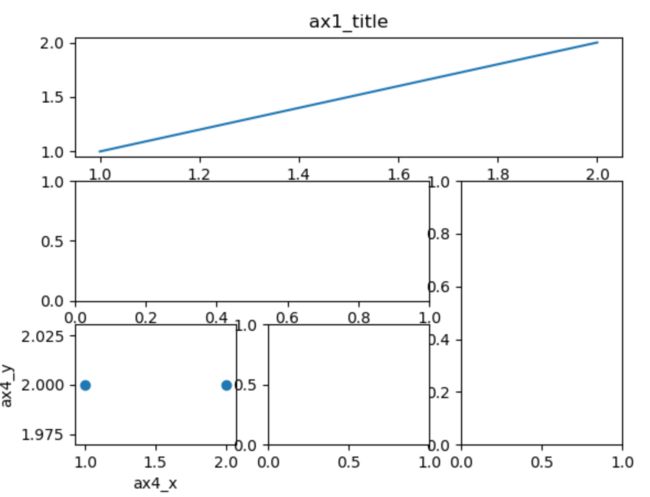
ax1 = plt.subplot2grid((3, 3), (0, 0), colspan=3)  # stands for axes
ax1.plot([1, 2], [1, 2])
ax1.set_title('ax1_title')
ax2 = plt.subplot2grid((3, 3), (1, 0), colspan=2)
ax3 = plt.subplot2grid((3, 3), (1, 2), rowspan=2)
ax4 = plt.subplot2grid((3, 3), (2, 0))
ax4.scatter([1, 2], [2, 2])
ax4.set_xlabel('ax4_x')
ax4.set_ylabel('ax4_y')
ax5 = plt.subplot2grid((3, 3), (2, 1))

# method 2: gridspec
#########################
plt.figure()
gs = gridspec.GridSpec(3, 3)
# use index from 0
ax6 = plt.subplot(gs[0, :])
ax7 = plt.subplot(gs[1, :2])
ax8 = plt.subplot(gs[1:, 2])
ax9 = plt.subplot(gs[2, 0])
ax10 = plt.subplot(gs[-1, -2])
plt.show()

# method 3: easy to define structure
####################################
f, ((ax11, ax12), (ax13, ax14)) = plt.subplots(2, 2, sharex=True, sharey=True)
ax11.scatter([1,2], [1,2])

plt.tight_layout()
plt.show()
图中图
# View more python tutorials on my Youtube and Youku channel!!!

# Youtube video tutorial: https://www.youtube.com/channel/UCdyjiB5H8Pu7aDTNVXTTpcg
# Youku video tutorial: http://i.youku.com/pythontutorial

# 17 - plot in plot
"""
Please note, this script is for python3+.
If you are using python2+, please modify it accordingly.
Tutorial reference:
http://www.python-course.eu/matplotlib_multiple_figures.php
"""

import matplotlib.pyplot as plt

fig = plt.figure()
x = [1, 2, 3, 4, 5, 6, 7]
y = [1, 3, 4, 2, 5, 8, 6]

# below are all percentage
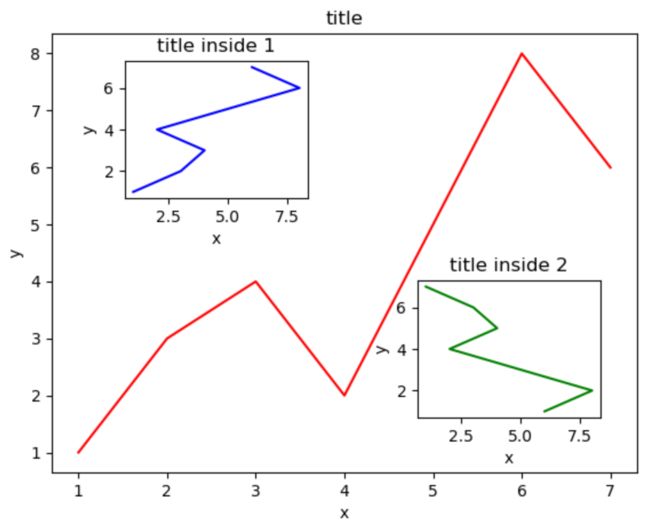
left, bottom, width, height = 0.1, 0.1, 0.8, 0.8
ax1 = fig.add_axes([left, bottom, width, height])  # main axes
ax1.plot(x, y, 'r')
ax1.set_xlabel('x')
ax1.set_ylabel('y')
ax1.set_title('title')

ax2 = fig.add_axes([0.2, 0.6, 0.25, 0.25])  # inside axes
ax2.plot(y, x, 'b')
ax2.set_xlabel('x')
ax2.set_ylabel('y')
ax2.set_title('title inside 1')


# different method to add axes
####################################
plt.axes([0.6, 0.2, 0.25, 0.25])
plt.plot(y[::-1], x, 'g')
plt.xlabel('x')
plt.ylabel('y')
plt.title('title inside 2')

plt.show()
次坐标轴
# View more python tutorials on my Youtube and Youku channel!!!

# Youtube video tutorial: https://www.youtube.com/channel/UCdyjiB5H8Pu7aDTNVXTTpcg
# Youku video tutorial: http://i.youku.com/pythontutorial

# 18 - secondary y axis
"""
Please note, this script is for python3+.
If you are using python2+, please modify it accordingly.
Tutorial reference:
http://www.python-course.eu/matplotlib_multiple_figures.php
"""

import matplotlib.pyplot as plt
import numpy as np

x = np.arange(0, 10, 0.1)
y1 = 0.05 * x**2
y2 = -1 *y1

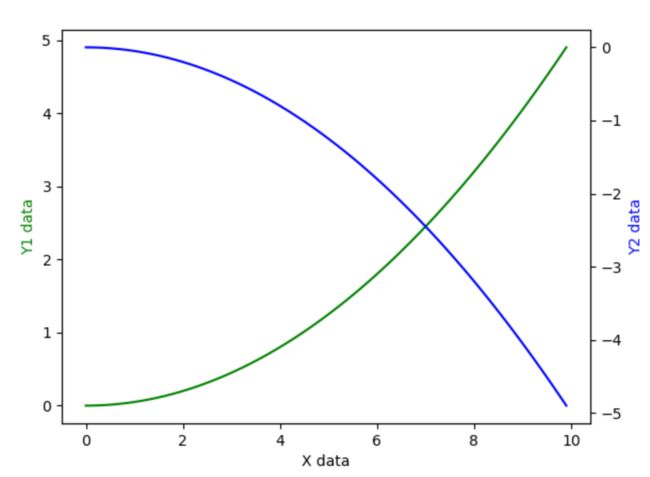
fig, ax1 = plt.subplots()

ax2 = ax1.twinx()    # mirror the ax1
ax1.plot(x, y1, 'g-')
ax2.plot(x, y2, 'b-')

ax1.set_xlabel('X data')
ax1.set_ylabel('Y1 data', color='g')
ax2.set_ylabel('Y2 data', color='b')

plt.show()
绘制动图
# View more python tutorials on my Youtube and Youku channel!!!

# Youtube video tutorial: https://www.youtube.com/channel/UCdyjiB5H8Pu7aDTNVXTTpcg
# Youku video tutorial: http://i.youku.com/pythontutorial

# 19 - animation
"""
Please note, this script is for python3+.
If you are using python2+, please modify it accordingly.

Tutorial reference:
http://matplotlib.org/examples/animation/simple_anim.html

More animation example code:
http://matplotlib.org/examples/animation/
"""

import numpy as np
from matplotlib import pyplot as plt
from matplotlib import animation

fig, ax = plt.subplots()

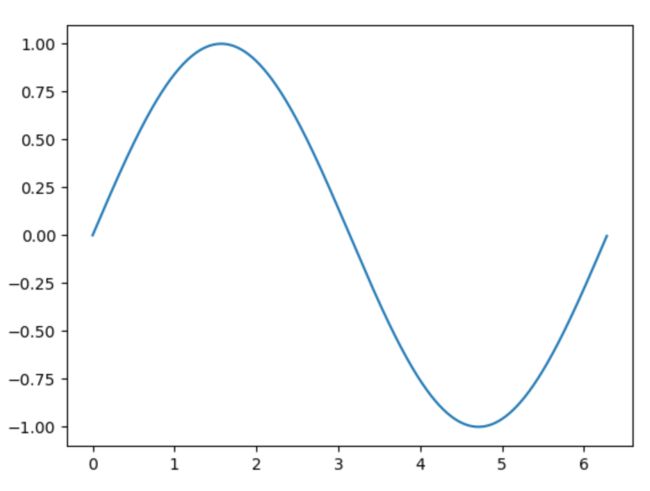
x = np.arange(0, 2*np.pi, 0.01)
line, = ax.plot(x, np.sin(x))


def animate(i):
    line.set_ydata(np.sin(x + i/10.0))  # update the data
    return line,


# Init only required for blitting to give a clean slate.
def init():
    line.set_ydata(np.sin(x))
    return line,

# call the animator.  blit=True means only re-draw the parts that have changed.
# blit=True dose not work on Mac, set blit=False
# interval= update frequency
ani = animation.FuncAnimation(fig=fig, func=animate, frames=100, init_func=init,
                              interval=20, blit=False)

# save the animation as an mp4.  This requires ffmpeg or mencoder to be
# installed.  The extra_args ensure that the x264 codec is used, so that
# the video can be embedded in html5.  You may need to adjust this for
# your system: for more information, see
# http://matplotlib.sourceforge.net/api/animation_api.html
# anim.save('basic_animation.mp4', fps=30, extra_args=['-vcodec', 'libx264'])

plt.show()


