ngs.plot 主要用于可视化基因组功能区域的高通量测序结果。
#1. ngs.plot 优点
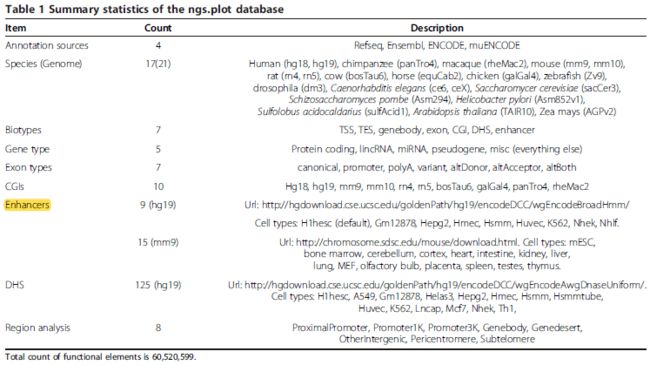
- 已整理的注释数据:17个物种(21套基因组),涉及功能原件有: Gene,Exon,CGIs,Enhancers,DHS
- 能够很好展示某类功能原件或者某部分区域的信号富集程度;
- 运行速度快,内存消耗适中。
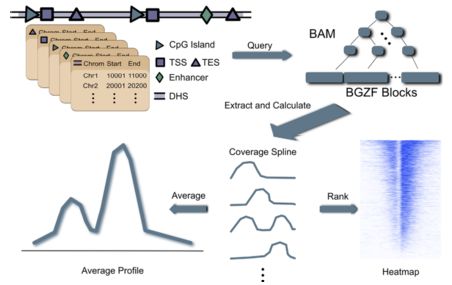
#2. ngs.plot 数据处理流程如下
- bam文件建立索引
- 根据功能原件的基因组坐标索引bam文件
- 计算功能原件区域富集信号丰度
- 画图:富集轮廓图和热图
#3. 支持的基因组 和自行构建基因组注释
- ngs.plot准备好基因组信息见 SupportedGenomes;
- 基因组文件下载: ngs.plot genome folder
- 自行构建基因组注释流程:ngsplotdb
#4. 扩展注释包: Enhancers 和 DHSs
基因组基础包只是包含 genebody, CGI, exon;对于hg19 和 mm9,ngs.plot 准备了额外的Enhancers 和 DHSs注释;
- 下载见: ngs.plot genome folder
#5. 安装
- 要求:
R >= 2.15.0 ,Python 2.7 -
ngs.plot程序下载:ngs.plot download GDrive
git clone https://github.com/shenlab-sinai/ngsplot.git
cd ngsplot/
#Add ngs.plot path in ~/.bash_profile
echo 'export PATH=~/software/ngsplot/bin:$PATH' >>~/.bash_profile
echo 'export NGSPLOT=~/software/ngsplot' >>~/.bash_profile
source ~/.bash_profile
install.packages("doMC", dep=T)
install.packages("caTools", dep=T)
install.packages("utils", dep=T)
- 对于R <3.0,多操作一步:
source("http://bioconductor.org/biocLite.R")
biocLite( "BSgenome" )
biocLite( "Rsamtools" )
biocLite( "ShortRead" )
#6. 使用
##6.1 注释数据的管理: ngsplotdb.py
# List installed genomes.
ngsplotdb.py list
# Install reference genome from a package file.
ngsplotdb.py install ngsplotdb_hg19_71_2.0.tar.gz
# Remove installed genome.
ngsplotdb.py remove hg19
# Remove enhancer installation from hg19.
ngsplotdb.py remove --ftr enhancer hg19
- "-F" 参数
#-F [gene_type][,sub_region][,cell_line or tissue][,exon_type][,rnaseq or chipseq]
-F K562  # Select cell line.
-F K562,lincRNA  # Select cell line and gene type.
-F lincRNA,K562  # Same as above(order does not matter).
-F Promoter3k,H1hesc,protein_coding  # Select region, cell line and gene type(apply to DHS only).
##6.2 ngs.plot.r 作图
ngs.plot.r参数设置,参考文章:ngs.plot 画图工具ngs.plot.r 和 replot.r 参数详解
- ngs.plot.r 可视化ChIP-seq 或 RNA-seq,对全基因组或者感兴趣的基因组功能原件富集信号进行可视化。
Usage: ngs.plot.r -G genome -R region -C [cov|config]file -O name [Options]
## 必须参数:
  -G   基因组
  -R   基因组区域tss, tes, genebody, exon, cgi, enhancer, dhs, bed
  -C   Indexed bam 文件 或 配置文件(可以同时画多个图)
  -O   输出结果前缀
##6.3 replot.r
ngs.plot.r参数设置,参考文章:[ngs.plot 画图工具ngs.plot.r 和 replot.r 参数详解]
- 利用ngs.plot.r 产生的画图数据进行重新画图
Usage: replot.r command -I input.zip -O name
  command: prof OR heatmap
## 必须参数:
    -I  ngs.plot.r 产生的画图数据
    -O  输出结果前缀
#7. 例子
##7.1 ngs.plot.r 作图
- 输入和输出
- 输入数据:建过索引的bam文件或者配置文件。
- 输出文件:一个富集轮廓图,一个热图,用于作图的数据保存的文件
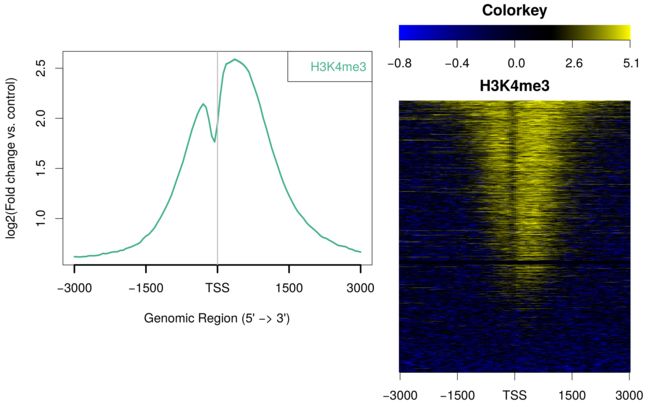
ngs.plot.r -G hg19 -R tss -C hesc.H3k4me3.rmdup.sort.bam -O hesc.H3k4me3.tss -T H3K4me3 -L 3000 -FL 300
- ngs.plot.r 作图也可以使用一对bam文件,例如,ChIP vs. Input。
ngs.plot.r -G hg19 -R tss -C hesc.H3k4me3.rmdup.sort.bam:hesc.Input.rmdup.sort.bam -O hesc.H3k4me3vsInp.tss -T H3K4me3 -L 3000
Data from: Ernst, J., et al. (2011). Mapping and analysis of chromatin state dynamics in nine human cell types. Nature 473, 43-49.
- ngs.plot 对多个数据作图
- 需要使用参数-C 导入配置文件,下面看几个例子:
data are from: ENCODE Project Consortium, et al. (2012). An integrated encyclopedia of DNA elements in the human genome. Nature 489, 57-74.
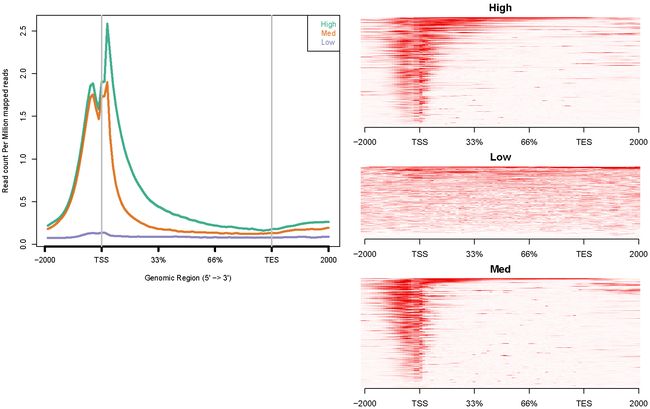
H3K4me3配置文件:config.hesc.k36.txt
# If you want to specify the gene list as "genome", use "-1".
# Use TAB to separate the three columns: coverage filegene listtitle
# "title" will be shown in the figure's legend.
hesc.H3k4me3.rmdup.sort.bam     high_expressed_genes.txt         "High"
hesc.H3k4me3.rmdup.sort.bam     medium_expressed_genes.txt       "Med"
hesc.H3k4me3.rmdup.sort.bam     low_expressed_genes.txt          "Low"
ngs.plot.r -G hg19 -R genebody -C config.hesc.k4.txt -O hesc.k4.genebody -D ensembl -FL 300
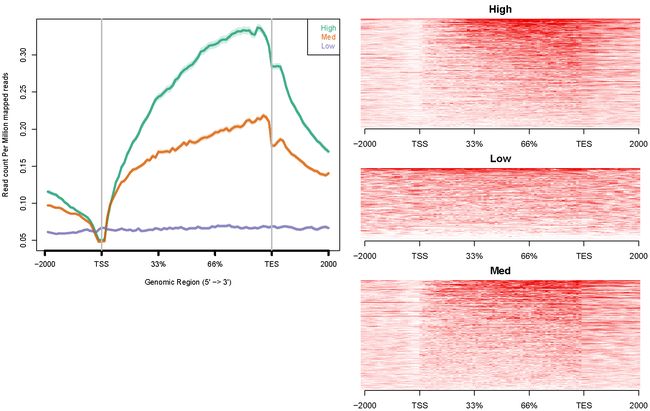
H3K36me3配置文件:config.hesc.k36.txt
hesc.H3k36me3.rmdup.sort.bam     high_expressed_genes.txt         "High"
hesc.H3k36me3.rmdup.sort.bam     medium_expressed_genes.txt       "Med"
hesc.H3k36me3.rmdup.sort.bam     low_expressed_genes.txt          "Low"
ngs.plot.r -G hg19 -R genebody -C config.hesc.k36.txt -O hesc.k36.genebody -D ensembl -FL 300
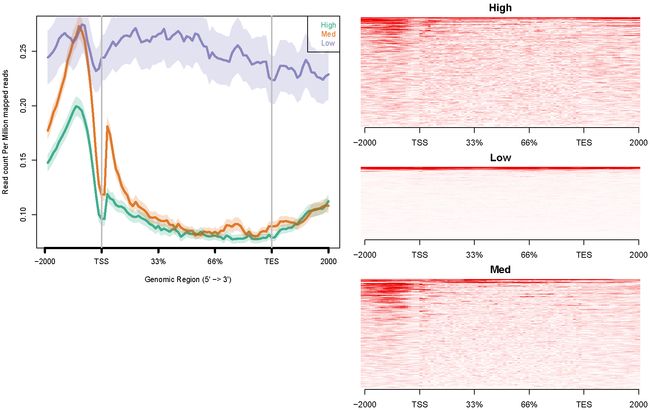
H3K27me3配置文件:config.hesc.k27.txt
hesc.H3k27me3.rmdup.sort.bam     high_expressed_genes.txt         "High"
hesc.H3k27me3.rmdup.sort.bam     medium_expressed_genes.txt       "Med"
hesc.H3k27me3.rmdup.sort.bam     low_expressed_genes.txt          "Low"
ngs.plot.r -G hg19 -R genebody -C config.hesc.k27.txt -O hesc.k27.genebody -D ensembl -FL 300
做热图时,ngs.plot 有不同的基因或区域排序算法,也有层次聚类和k-means两种聚类方法。为例避免高测序深度样本带来的偏差; 在聚类时,将值转化为排名。
配置文件: config.k4k27.inp.txt
hesc.H3k27me3.sort.bam:hesc.Input.sort.bam    -1      "H3k27me3"
hesc.H3k4me3.sort.bam:hesc.Input.sort.bam     -1      "H3k4me3"
ngs.plot.r -G hg19 -R genebody -L 3000 -C config.k4k27.inp.txt -O k4k27_km_gb -GO km
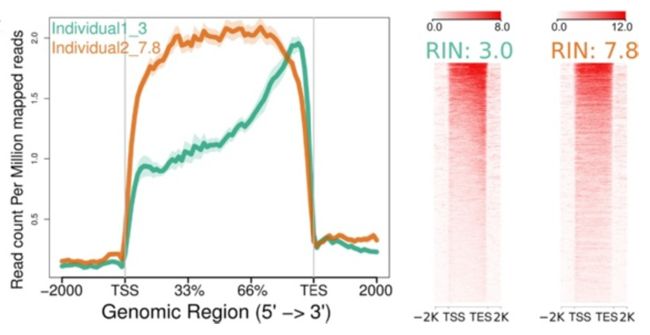
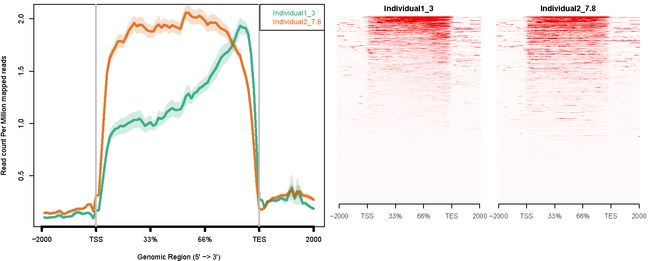
- ngs.plot 也可以用于 RNA-seq数据; 对于RNA完整度为7.8的测序数据和降解到完整度只有3的测序数据进行分析:
Individual1_3.bam     -1       "Individual1_3"
Individual2_7.8.bam   -1       "Individual2_7.8"
ngs.plot.r -G hg19 -R genebody -C config.RIN_number.txt -O RIN_number -F rnaseq
8. 参考
- ngsplot
- ngs.plot: Quick mining and visualization of next-generation sequencing data by integrating genomic databases
- ngs.plot 画图工具ngs.plot.r 和 replot.r 参数详解
ChIP-Seq 数据挖掘系列文章目录:
ChIP-Seq数据挖掘系列-1:Motif 分析(1)-HOMER 安装
ChIP-Seq数据挖掘系列-2: Motif 分析(2) - HOMER Motif 分析基本步骤
ChIP-Seq数据挖掘系列-3: Motif 分析(3) - 利用ChIP-Seq结果在基因组区域中寻找富集的Motifs
ChIP-Seq数据挖掘系列-4: liftOver - 基因组坐标在不同基因组注释版本间转换
ChIP-Seq数据挖掘系列-5.1: ngs.plot 可视化ChIP-Seq 数据
ChIP-Seq数据挖掘系列-5.2: ngs.plot 画图工具ngs.plot.r 和 replot.r 参数详解
