问题:
最近一直被这个问题困扰 zabbix 点击用户标签后就卡住了,这个zabbix安装到现在2年多的时间。
如下图,
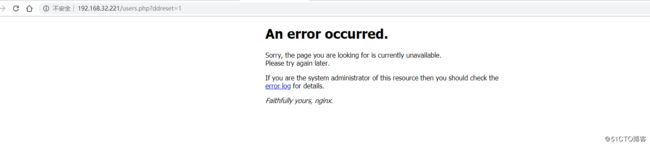
解决方案:
删除 sessions表中的记录
sessions 表很重要,保存了每个用户的sessions,在登陆、注销的时候均会操作
该张表的。
登陆数据库:
[root@zabbixmysql ~]# mysql -uroot -p
Enter password:
Welcome to the MySQL monitor.  Commands end with ; or \g.
Your MySQL connection id is 158608484
Server version: 5.7.18-log MySQL Community Server (GPL)

Copyright (c) 2000, 2013, Oracle and/or its affiliates. All rights reserved.

Oracle is a registered trademark of Oracle Corporation and/or its
affiliates. Other names may be trademarks of their respective
owners.

Type 'help;' or '\h' for help. Type '\c' to clear the current input statement.

mysql>
mysql> show databases;
+--------------------+
| Database           |
+--------------------+
| information_schema |
| haiwai_zabbix      |
| mysql              |
| percona_schema     |
| performance_schema |
| sys                |
| zabbix             |
| zabbix_proxy       |
| zabbix_server      |
| zabbix_test        |
+--------------------+
10 rows in set (0.06 sec)

mysql>  use haiwai_zabbix;
mysql> show tables;
+----------------------------+
| Tables_in_haiwai_zabbix    |
+----------------------------+
| acknowledges               |
| actions                    |
| alerts                     |
| application_discovery      |
| application_prototype      |
| application_template       |
| applications               |
| auditlog                   |
| auditlog_details           |
| autoreg_host               |
| checksums                  |
| conditions                 |
| config                     |
| corr_condition             |
| corr_condition_group       |
| corr_condition_tag         |
| corr_condition_tagpair     |
| corr_condition_tagvalue    |
| corr_operation             |
| correlation                |
| dbversion                  |
| dchecks                    |
| dhosts                     |
| drules                     |
| dservices                  |
| escalations                |
| event_recovery             |
| event_tag                  |
| events                     |
| expressions                |
| functions                  |
| globalmacro                |
| globalvars                 |
| graph_discovery            |
| graph_theme                |
| graphs                     |
| graphs_items               |
| group_discovery            |
| group_prototype            |
| groups                     |
| his                        |
| history                    |
| history_log                |
| history_str                |
| history_text               |
| history_uint               |
| host_discovery             |
| host_inventory             |
| hostmacro                  |
| hosts                      |
| hosts_groups               |
| hosts_templates            |
| housekeeper                |
| httpstep                   |
| httpstepitem               |
| httptest                   |
| httptestitem               |
| icon_map                   |
| icon_mapping               |
| ids                        |
| images                     |
| interface                  |
| interface_discovery        |
| item_application_prototype |
| item_condition             |
| item_discovery             |
| items                      |
| items_applications         |
| maintenances               |
| maintenances_groups        |
| maintenances_hosts         |
| maintenances_windows       |
| mappings                   |
| media                      |
| media_type                 |
| opcommand                  |
| opcommand_grp              |
| opcommand_hst              |
| opconditions               |
| operations                 |
| opgroup                    |
| opinventory                |
| opmessage                  |
| opmessage_grp              |
| opmessage_usr              |
| optemplate                 |
| problem                    |
| problem_tag                |
| profiles                   |
| proxy_autoreg_host         |
| proxy_dhistory             |
| proxy_history              |
| regexps                    |
| rights                     |
| screen_user                |
| screen_usrgrp              |
| screens                    |
| screens_items              |
| scripts                    |
| service_alarms             |
| services                   |
| services_links             |
| services_times             |
| sessions                   |
| slides                     |
| slideshow_user             |
| slideshow_usrgrp           |
| slideshows                 |
| sysmap_element_url         |
| sysmap_url                 |
| sysmap_user                |
| sysmap_usrgrp              |
| sysmaps                    |
| sysmaps_elements           |
| sysmaps_link_triggers      |
| sysmaps_links              |
| task                       |
| task_close_problem         |
| timeperiods                |
| trends                     |
| trends_uint                |
| trigger_depends            |
| trigger_discovery          |
| trigger_tag                |
| triggers                   |
| users                      |
| users_groups               |
| usrgrp                     |
| valuemaps                  |
+----------------------------+
129 rows in set (0.01 sec)

mysql>
查询数据库sessions表条目数量
mysql> select count(*) from sessions;
+----------+
| count(*) |
+----------+
| 23143363 |
+----------+
1 row in set (10.28 sec)
下面这条命令是按sessions 表中 lastaccess 字段的时间 删除 2019/10/31 12:0:00 之前的所有条目
mysql> delete from sessions where FROM_UNIXTIME(lastaccess)>FROM_UNIXTIME(1572494400); (2019/10/31 12:0:0)我本意是想删除2019/10/31 12:0:0 以前的数,最后删除后发现 还有2千多万条,想想是不对的,select 一下发现 把10月31号之后的记录删除了。我擦擦。。。。
修改语句如下:
mysql> delete from sessions where FROM_UNIXTIME(lastaccess)<FROM_UNIXTIME(1572494400); (2019/10/31 12:0:0)
验证如下:
mysql> select * from sessions limit 10 ;mysql> select count(*) from sessions;
+----------+
| count(*) |
+----------+
| 4178 |
+----------+
1 row in set (7.01 sec)
mysql> 完美搞定点击用户hang住的问题。
追加一些其它的查询
切换到 information_schema数据库
mysql> use information_schema;
查询mysql数据最大的10张表
mysql> select TABLE_SCHEMA,table_name,table_rows,ENGINE,DATA_LENGTH,MAX_DATA_LENGTH,DATA_FREE from tables order by table_rows desc limit 10;
+---------------+--------------+------------+--------+-------------+-----------------+-------------+
| TABLE_SCHEMA | table_name | table_rows | ENGINE | DATA_LENGTH | MAX_DATA_LENGTH | DATA_FREE |
+---------------+--------------+------------+--------+-------------+-----------------+-------------+
| haiwai_zabbix | history_uint | 438673983 | InnoDB | 37073469440 | 0 | 145752064 |
| haiwai_zabbix | history | 227527074 | InnoDB | 21833465856 | 0 | 114294784 |
| haiwai_zabbix | trends_uint | 100126348 | InnoDB | 7990231040 | 0 | 93323264 |
| zabbix_server | history | 58115887 | InnoDB | 3786424320 | 0 | 0 |
| haiwai_zabbix | trends | 37399078 | InnoDB | 3267461120 | 0 | 26214400 |
| haiwai_zabbix | history_log | 34415220 | InnoDB | 18999181312 | 0 | 19042140160 |
| haiwai_zabbix | sessions | 24138136 | InnoDB | 3531407360 | 0 | 504365056 |
| zabbix_test | trends_uint | 21860377 | InnoDB | 1386217472 | 0 | 0 |
| haiwai_zabbix | history_str | 20434046 | InnoDB | 1628454912 | 0 | 82837504 |
| zabbix_server | history_uint | 17969842 | InnoDB | 1420836864 | 0 | 0 |
+---------------+--------------+------------+--------+-------------+-----------------+-------------+
10 rows in set, 48 warnings (12.80 sec)
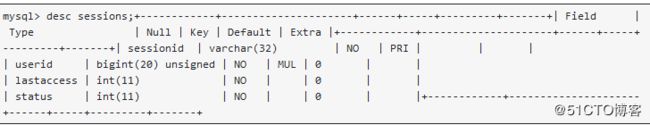
mysql> 查看表字段
mysql>desc 表名
mysql> desc history_unit;
mysql> desc history_uint ;
+--------+---------------------+------+-----+---------+-------+
| Field  | Type                | Null | Key | Default | Extra |
+--------+---------------------+------+-----+---------+-------+
| itemid | bigint(20) unsigned | NO   | MUL | NULL    |       |
| clock  | int(11)             | NO   |     | 0       |       |
| value  | bigint(20) unsigned | NO   |     | 0       |       |
| ns     | int(11)             | NO   |     | 0       |       |
+--------+---------------------+------+-----+---------+-------+
4 rows in set (0.00 sec)

mysql>
查history_unit表中10行的条目
mysql> select * from  history_uint  limit 10;
+--------+------------+-------+-----------+
| itemid | clock      | value | ns        |
+--------+------------+-------+-----------+
|  31558 | 1500590724 |     1 |  50697203 |
|  33718 | 1500590724 |     1 |  61039023 |
|  24456 | 1500590724 |     0 | 292227168 |
|  31559 | 1500590725 |     1 |  51844995 |
|  33719 | 1500590725 |     1 |  66514533 |
|  41519 | 1500590725 |     1 |  70626763 |
|  42059 | 1500590725 |     1 | 278047684 |
|  31560 | 1500590726 |     1 |  63953848 |
|  33720 | 1500590726 |     1 |  71027961 |
|  31561 | 1500590727 |     1 |  64017492 |
+--------+------------+-------+-----------+
10 rows in set (0.00 sec)

mysql>