有什么问题可以进qq群讨论 131657381
闲话不多说,先到上动态图让大家看看。使用起来超级简单,完美适配ios和android
chart.gif
简单介绍一下:
1.苹果 橘子 这个可以根据legend这个属性来设置,可一个可多个。具体参考代码
2.可以是单独的一种图形,也可以是多种切换
3.图形的颜色可以根据color属性来改,具体请参考代码
下面介绍下使用方法:
1。 yarn add native-echarts
2。没有了。。。就是这么简单
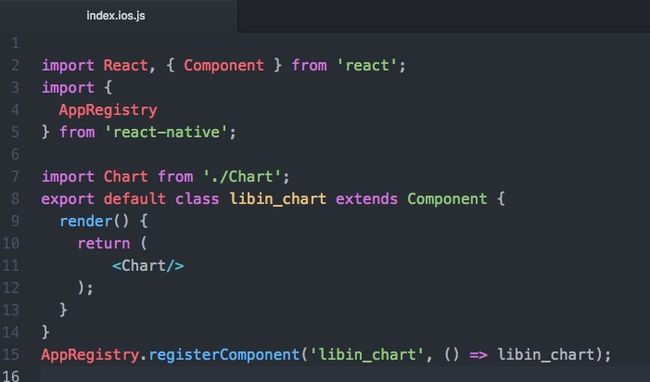
09FB6703-EA4A-4440-86D0-FE8C619B3EF1.png
import React, { Component } from 'react';
import {
  AppRegistry,
  StyleSheet,
  Text,
  View,
  Platform
} from 'react-native';

import Echarts from 'native-echarts';
import Dimensions from 'Dimensions';
const {width} = Dimensions.get('window');
export default class Chart extends Component {

  constructor(props) {
      super(props);
      this.state = {
        apple:[2, 4, 7, 2, 2, 7, 13, 16],
        organ: [6, 9, 9, 2, 8, 7, 17, 18],
      }
  }

  render() {
    const option = {
          //点击某一个点的数据的时候,显示出悬浮窗
          tooltip : {
              trigger: 'axis'
          },
          //可以手动选择现实几个图标
          legend: {
              data:['苹果','橘子']
          },
          //各种表格
          toolbox: {
              //改变icon的布局朝向
              //orient: 'vertical',
              show : true,
              showTitle:true,
              feature : {
                  //show是否显示表格,readOnly是否只读
                  dataView : {show: true, readOnly: false},
                  magicType : {
                    //折线图  柱形图    总数统计 分开平铺
                    type: ['line', 'bar','stack','tiled'],
                  },

              }
          },
          xAxis : [
              {
                  //就是一月份这个显示为一个线段,而不是数轴那种一个点点
                  boundaryGap:true,
                  type : 'category',
                  name : '时间',
                  data : ['1月','2月','3月','4月','5月','6月','7月','8月']
              }
          ],
          yAxis : [
              {
                  type : 'value',
                  name : '销量(kg)'
              }
          ],
          //图形的颜色组
          color:['rgb(249,159,94)','rgb(67,205,126)'],
          //需要显示的图形名称,类型,以及数据设置
          series : [
              {
                  name:'苹果',
                  //默认显
                  type:'bar',
                  data:this.state.apple
              },
              {
                  name:'橘子',
                  type:'bar',
                  data:this.state.organ
              }
          ]
        };
  return (


          每月苹果橘子销量统计图


    );
  }
}

const styles = StyleSheet.create({
  container: {
    flex:1,
  },

  titleView:{
    height:Platform.OS=='ios'?64:44,
    paddingTop:Platform.OS=='ios'?14:0,
    backgroundColor:'#ff6400',
    justifyContent: 'center',
    alignItems: 'center',
  },
  title:{
    color:'white',
    fontSize:20,
    textAlign:'center',
  },
});
第一次写,写得不好的地方请大家见谅,提醒。谢谢
补充一个问题,android打包后显示不出来 ,请看我的的另一片文章