摘要:本文主要结合实际案例介绍多项式回归, 多项式回归主要包括一元多项式回归和多元多项式回归,本文主要介绍的是一元多项式回归。
在一元回归分析中,如果自变量x和因变量y之间的关系是非线性的,在找不到合适的函数曲线来拟合的情况下,可以采用一元多项式回归。如果自变量不止一个,则采用多元多项式回归。
多项式回归可以处理相当一类非线性问题,因为任意函数都可以分段,用多项式来逼近。
本文采用的案例数据为杭州西溪板块的二手房价信息,数据是用集搜客(GooSeeker)爬虫工具用从链家官网爬取的。为了说明多项式回归,对部分房价数据做了修改。
读取并观察数据:
import numpy as np
import pandas as pd
import matplotlib.pyplot as plt
%matplotlib inline
data = pd.read_csv('house_price.csv')
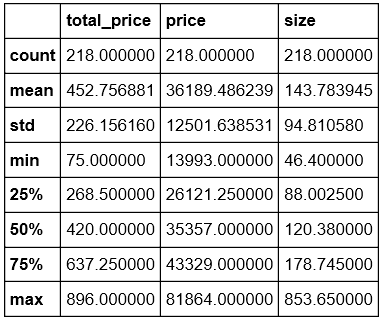
data.describe()
#观察数据,发现离群数据size = 853.65,处理
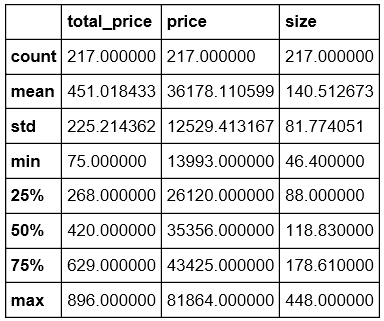
data = data[data['size']<= 500]
data.describe()
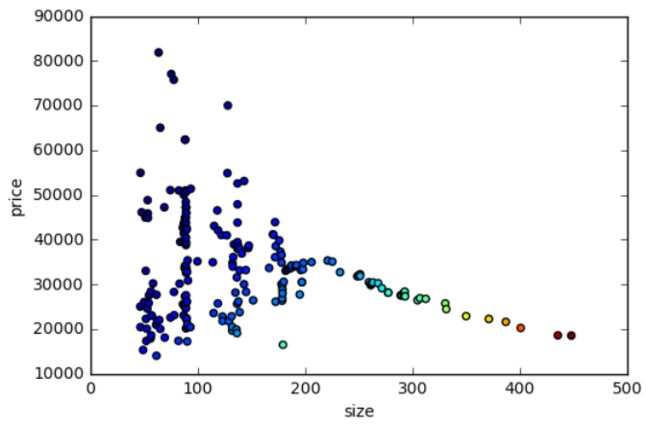
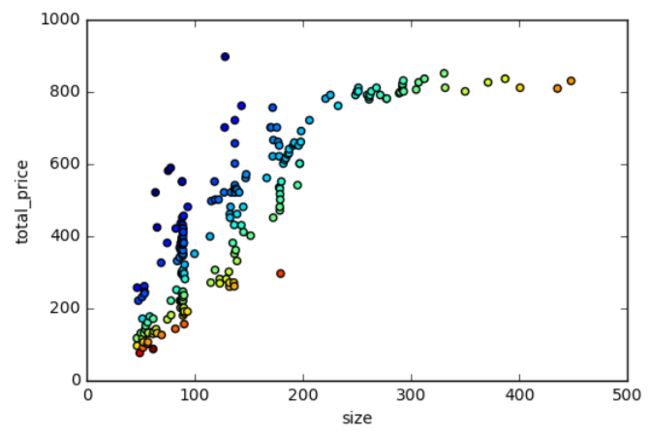
我们用散点图分别查看“单价”、“总价”和“大小”的关系:
#大小和单价的关系
fig = plt.figure(figsize=(6,4))
T = np.arctan2(data['size'],data['price'])
plt.scatter(data['size'],data['price'], c=T)
plt.xlabel('size')
plt.ylabel('price')
plt.show()
#大小和总价的关系
fig = plt.figure(figsize=(6,4))
T2 = np.arctan2(data['size'],data['total_price'])
plt.scatter(data['size'],data['total_price'], c=T2)
plt.xlabel('size')
plt.ylabel('total_price')
plt.show()
可以看到,总价和大小之间呈现更明显的相关性。我们分别以【大小】和【总价】做为输入变量和输出变量,说明多项式回归的应用。
在进行建模之前,我们先把数据集拆分为训练集和测试集。Scikit-learn中提供了拆分数据集的函数train_test_split用来做较差验证。
#拆分数据集为训练集和测试集
from sklearn.cross_validation import train_test_split

xtrain, xtest, ytrain, ytest = train_test_split(data['size'], data['total_price'])
xtrain = xtrain.reshape(len(xtrain),1)
ytrain = ytrain.reshape(len(ytrain),1)
xtest = xtest.reshape(len(xtest),1)
ytest = ytest.reshape(len(ytest),1)
一元线性回归
为了对比,我们首先用一元线性回归模型来描述【大小】和【总价】之间的关系。
#构建一元线性回归模型
from sklearn.linear_model import LinearRegression
lr = LinearRegression()
lr.fit(xtrain, ytrain)
plt.scatter(xtrain, ytrain)
plt.plot(xtest, lr.predict(xtest), 'g-')
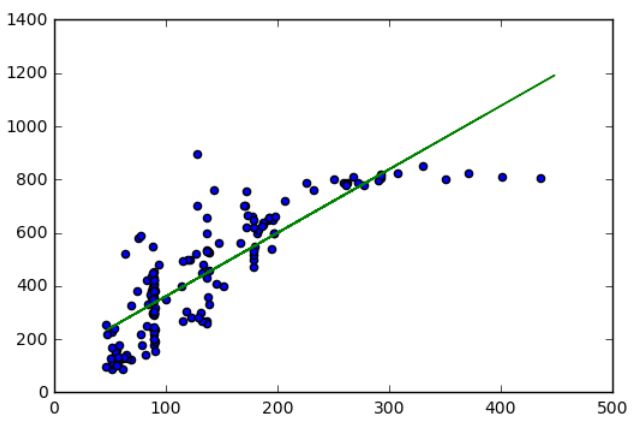
可以看到,一元线性回归模型并不能很好的拟合【大小】和【总价】数据,不能很好的描述两者之间的关系。
计算R^2,发现拟合优度也不太满意:
# 计算R方
r_score = lr.score(xtest,ytest)
R^2 = 0.75
一元多项式回归
Scikit-learn的preprocessing库中,提供了PolynomialFeatures类对数据进行多项式转换。
from sklearn.preprocessing import PolynomialFeatures
pol = PolynomialFeatures(degree = 2)
其中degree就是我们要处理的自变量的指数,如果degree = 1,就是普通的线性回归。
官方对degree的解释如下:
Generate polynomial and interaction features.
Generate a new feature matrix consisting of all polynomial combinations of the features with degree less than or equal to the specified degree. For example, if an input sample is two dimensional and of the form [a, b], the degree-2 polynomial features are [1, a, b, a^2, ab, b^2].
在处理多项式回归的过程中,需要使用fit_transform函数对训练集数据先进行拟合,然后再标准化,然后对测试集数据使用transform进行标准化,属于数据预处理的一种方法,后续文章中会再提到。
#对训练集进行拟合标准化处理
xtrain_pol = pol.fit_transform(xtrain)
#模型初始化
lr_pol = LinearRegression()
#拟合
lr_pol.fit(xtrain_pol, ytrain)
#对测试集进行重构
x = np.arange(min(xtest), max(xtest)).reshape([-1,1])

#预测及展示
plt.scatter(xtrain, ytrain)
plt.plot(x, lr_pol.predict(pol.transform(x)), c='red')
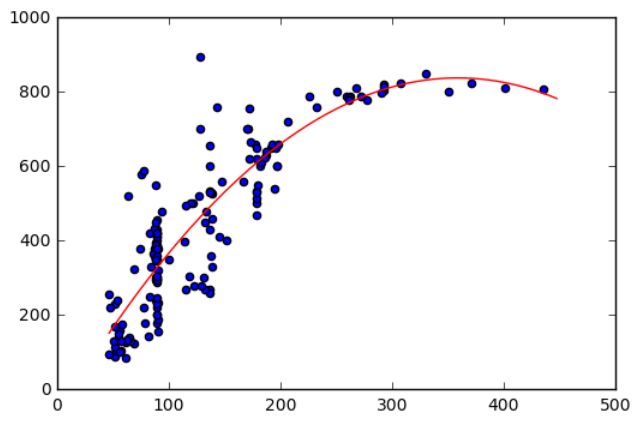
可以看到,多项式回归的拟合度比线性回归要好很多。我们计算一下R^2:
r_score_pol = lr_pol.score(pol.transform(xtest), ytest)
得到R^2 = 0.82099383118934888
对比线性回归的R^2值 = 0.75,可以看到,多项式回归的拟合效果比现行回归好很多。
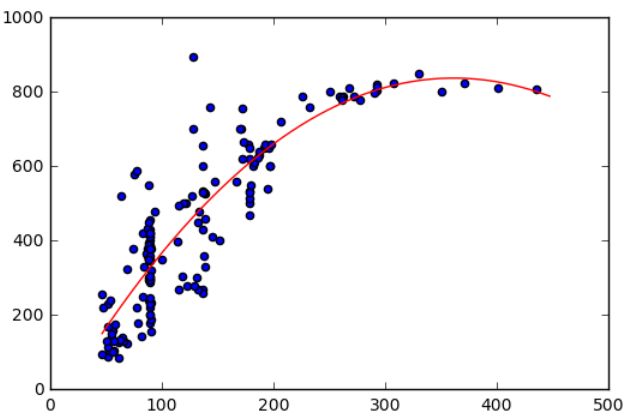
我们把degree提升到3,执行同样的语句,得到如下曲线:
得到R^2 = 0.82082180554068496
再把degree提升到7,得到曲线如下:
得到R^2 = 0.81872364187726354
| Degree | R^2 |
|---|---|
| 1 | 0.7497565222717566 |
| 2 | 0.82099383118934888 |
| 3 | 0.82082180554068496 |
| 7 | 0.81872364187726354 |
可以看到,degree = 7的时候,虽然曲线经过的点更多,但R^2值更低,拟合度并没有更好,这种情况是记忆训练的结果,在训练集效果很好,但在测试集上效果就不好了,是一种过拟合(over-fitting)。所以需要注意的是,degree太高,容易出现过拟合问题。
一篇很好的理解fit_transformer和transformer的概念以及区别的blog
