- Java——通配符以及上下限
六七_Shmily
javajavawindows开发语言
在Java泛型中,通配符?用于表示未知类型,通常用于增强泛型的灵活性。通配符可以与上限和下限结合使用,进一步限制类型的范围。以下是通配符及其上下限的详细介绍:一、通配符?的基本用法通配符?表示未知类型,可以用于泛型类、泛型接口和泛型方法的参数类型。示例:使用通配符//定义一个方法,接受任意类型的ListpublicstaticvoidprintList(Listlist){for(Objectel
- Pandas使用教程 - Pandas 与 Parquet 数据交互
闲人编程
Pandas使用教程pandasParquet数据交互高效压缩跨平台python
目录进阶篇46.Pandas与Parquet数据交互1.Parquet格式简介2.使用Pandas读取Parquet数据2.1基本用法2.2参数说明3.使用Pandas写入Parquet数据3.1基本用法3.2参数说明4.依赖库与性能优化4.1依赖库4.2性能优化策略5.实际案例:从Parquet文件加载与存储股票数据6.总结7.参考资料进阶篇46.Pandas与Parquet数据交互Parque
- Java反射
qq_65860758
java开发语言
Java反射:深入探索与实战应用在Java编程的世界里,反射(Reflection)是一种强大的机制,它允许程序在运行时检查、修改和操作自身的结构和行为。通过反射,你可以动态地获取类的属性、方法、构造函数等信息,甚至可以调用私有方法和访问私有字段。这种能力在框架开发、依赖注入、测试工具等场景中尤为重要。本文将带你深入了解Java反射的工作原理、基本用法以及实战应用。一、反射的基本概念反射的核心在于
- Python Selenium 库学习指南
不是二师兄的八戒
pythonselenium
PythonSelenium库学习指南目录Selenium基础介绍Selenium是什么安装SeleniumSelenium的工作原理Selenium基本用法启动浏览器定位元素常见操作:点击、输入、滚动高级用法切换窗口与标签页模拟鼠标操作与键盘输入动态加载的网页处理等待机制显式等待与隐式等待等待条件与时间限制Selenium与浏览器交互模拟用户行为上传与下载文件Selenium与JavaScrip
- Python爬虫库Selenium
.NET跨平台
Selenium库是一个自动化测试工具,支持多种浏览器。在爬虫中主要解决JavaScript渲染的问题。用法讲解:0.基本用法fromseleniumimportwebdriverfromselenium.webdriver.common.byimportByfromselenium.webdriver.common.keysimportKeysfromselenium.webdriver.sup
- 软件测试24-紧跟时代步伐:微服务模式下API测试要怎么做?
程序员zhi路
软件工程&软件测试微服务架构云原生
通过一个的RestfulAPI实例,我介绍了cURL和Postman工具的基本用法,这样我们对API测试有了一个感性认识;在此基础上,我介绍了API自动化测试框架发展的来龙去脉,借此我们对API测试框架的理解又更深入了一层。今天,我将更进一步,带你去了解当下最热门的技术领域的API测试,即微服务模式下的API测试。微服务架构下,API测试的最大挑战来自于庞大的测试用例数量,以及微服务之间的相互耦合
- Matplotlib Introductory Basic Usage
如桶底子脱
#数据分析机器学习进阶matplotlibpython开发语言
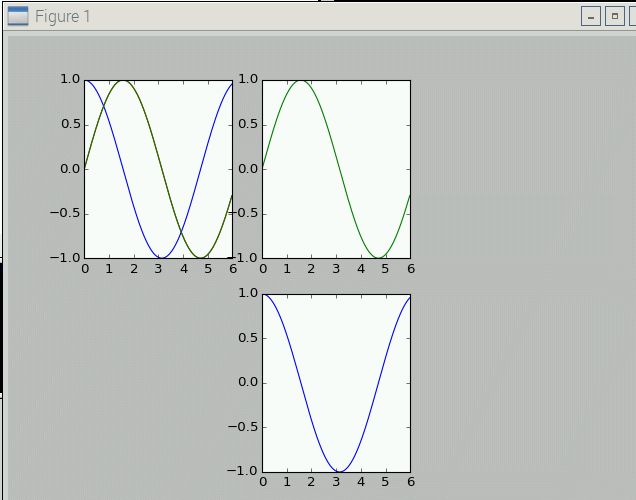
Introductory总览介绍了Matplotlib的基本用法,Figure,Axes,Axis,Artist等基本的类.函数包括ax1.twinx()生成一个Axes共享ax1的x轴ax3.secondary_xaxis(position,functions)给ax3添加一个x轴返回值ax:axes._secondary_axes.SecondaryAxispcolormesh(),conto
- 【Oracle11g SQL详解】INSERT INTO 的用法及插入数据注意事项
m0_74823715
面试学习路线阿里巴巴sql数据库
INSERTINTO的用法及插入数据注意事项在Oracle11g中,INSERTINTO语句用于向表中插入数据,是数据写入操作中最常用的SQL语句之一。本文将详细介绍INSERTINTO的基本语法、常见场景、注意事项及常见错误处理。一、INSERTINTO的基本语法INSERTINTO支持两种基本用法:指定列插入(推荐,明确指定列名,有助于维护性)。完整插入(省略列名,插入所有列的值)。1.指定列
- Axios:高效处理HTTP请求的利器
winxinxian
http网络协议网络
Axios:高效处理HTTP请求的利器在现代Web开发中,处理HTTP请求是一项基础且至关重要的任务。Axios,作为一个基于Promise的HTTP客户端,因其简洁的API设计、强大的功能和跨平台兼容性(支持浏览器和Node.js环境),成为了众多开发者的首选工具。本文将详细介绍Axios的基本用法、高级功能以及在实际开发中的应用。一、Axios简介Axios是一个基于Promise的网络请求库
- 掌握 ElasticSearch的 _source 过滤
全端工程师
elasticsearchelasticsearch大数据
掌握ElasticSearch的_source过滤1.引言2.`_source`元数据基础2.1什么是`_source`字段?2.2`_source`的基本用法3.禁用`_source`3.1如何禁用`_source`字段3.2禁用`_source`的利弊3.3最佳实践建议4.`_source`数据源过滤4.1为什么需要数据源过滤?4.2两种过滤方式4.2.1在Mapping中定义(不推荐)4.2
- 数组的相关概念1
陈体苗
conclusionc++算法开发语言
1.引用(reference)的基本用法#includeusingnamespacestd;intmain(){inta=10;//thedeclarationandinitializationofvariablesint&ra=a;//declarevariablesstd::cout#includeusingnamespacestd;intmain(){inta=10;int&ra=a;ra+
- 【MySQL】基础实战篇(2)—数据查询操作
m0_74824496
面试学习路线阿里巴巴mysql数据库
前言数据查询是数据库管理系统应用的主要内容,也是用户对数据库最频繁、最常见的操作请求。数据查询可以根据用户提供的限定条件,从已存在的数据表中检索用户需要的数据。MySQL使用SELECT语句既可以完成简单的单表查询、联合查询,也可以完成复杂的联接查询、子查询,从数据库中检索符合用户需求的数据,并将结果集以表格的形式返回给用户。这里写目录标题前言学习目标单表查询查询语句的基本用法字段的别名DISTI
- Python 中@ 矩阵乘法运算符详细讲解
Charonrise
python矩阵开发语言
在Python中,@是矩阵乘法运算符,它用于矩阵与矩阵之间的乘法运算,也可以用于矩阵与向量之间的乘法。它是在Python3.5中引入的,用来专门处理线性代数中的矩阵乘法运算。1.基本用法@运算符的作用等价于numpy中的np.dot()或np.matmul()函数。例如:importnumpyasnp#定义两个矩阵A=np.array([[1,2],[3,4]])B=np.array([[5,6]
- MyBatis Generator(MBG)逆向工程生成的Example基本用法
逐码阳光
数据库javamybatis
MyBatisGenerator(MBG)逆向工程生成的`Example`类是一个非常有用的工具,它可以帮助我们构建复杂的查询条件,包括模糊查询、范围查询等。以下是`Example`类的一些基本用法:1.创建Example对象首先,你需要创建一个`Example`对象,这个对象代表了你要查询的表。```javaYourTableExampleexample=newYourTableExample(
- pnpm的基本用法
前端熊猫
pnpm
以下是pnpm的核心命令和使用指南,涵盖从安装依赖到项目管理的常见操作:1.基础命令(1)安装依赖pnpminstall#安装package.json中的所有依赖pnpminstall#安装指定包(自动添加到dependencies)
[email protected]#指定版本安装(2)添加依赖pnpmadd#添加开发依赖(保存到devDependencies)pnpmadd--save-dev#
- Spring Boot项目@Cacheable注解的使用
m0_54851477
面试学习路线阿里巴巴springbootspringjava
@Cacheable是Spring框架中用于缓存的注解之一,它可以帮助你轻松地将方法的结果缓存起来,从而提高应用的性能。下面详细介绍如何使用@Cacheable注解以及相关的配置和注意事项。1.基本用法1.1添加依赖首先,确保你的项目中包含了SpringCache的依赖。如果你使用的是SpringBoot,可以在pom.xml或build.gradle中添加以下依赖:Maven:org.sprin
- Zap:Go 的高性能日志库
叫我DPT
gogolang后端zap
文章目录Zap:Go高性能日志库一、Zap的核心优势二、快速入门Zap1.安装2.基本用法输出示例三、Logger与SugaredLogger:如何选择?1.**Logger(高性能模式)**2.**SugaredLogger(开发友好模式)**四、高级配置与优化1.自定义日志配置2.日志切割(集成Lumberjack)五、与Gin框架集成1.替换Gin默认日志中间件2.记录自定义请求字段六、全局
- 【Python基础编程】深入掌握线程与线程池的高效应用
易辰君
python核心编程python开发语言
目录前言一、线程的使用(一)基础使用(二)等待线程完成(三)多个线程(四)守护线程(五)线程同步(六)总结二、队列对象-Queue(一)队列类型(二)基本用法(三)队列的常用方法(四)LIFO队列和优先级队列(五)适用场景(六)总结三、生产者和消费者模式(一)基本结构(二)生产者-消费者模式示例(三)多个生产者和消费者(四)适用场景(五)总结四、线程池(一)简介(二)线程池的使用(三)关键方法(四
- python 基本用法
选与握
#pythonpython人工智能开发语言
1[None]importnumpyasnp#创建一个示例数组img_pre=np.array([[1,2,3],[4,5,6]])#使用...进行索引result=img_pre[...][None]print("原始数组形状:",img_pre.shape)print("操作后数组形状:",result.shape)代码解释...操作符:...(省略号)在NumPy中是一个特殊的索引对象,它表
- Java常用开源库: apache HttpClient 4.x, oktttp, jetty HttpClient
wzj_whut
后端
文章目录apachehttpclientGETPOSTFormPOSTString上传文件/Multipart设置超时启用cookieokhttp基本用法上传文件POST设置超时websocketjettyhttpclientapachehttpclienthttps://mvnrepository.com/artifact/org.apache.httpcomponents/httpclient
- Nginx 的 proxy_pass 使用简介
m0_74825223
面试学习路线阿里巴巴nginx运维
文章目录1.基本概念1.1`proxy_pass`概述1.2语法1.3使用场景2.基本用法2.1HTTP代理2.1.1基本示例2.1.2绝对根路径vs相对路径2.2Stream代理3.高级用法3.1正则匹配3.2变量使用3.3重定向3.4精确匹配3.5`if`语句3.6`limit_except`4.实际案例4.1转发到多个后端服务器4.2转发到不同路径4.3转发到UnixDomainSocket
- Java 中的泛型讲解与使用(超全详解)
C_V_Better
javajava后端算法数据结构开发语言
Java中的泛型(超全详解)在Java编程中,泛型是一种强大的特性,它允许我们编写可以处理多种数据类型的代码,从而提高代码的复用性和安全性。本文将对Java中的泛型进行超全详解,包括泛型的基本概念、基本用法、通配符、泛型方法、类型擦除以及实际应用示例,帮助你全面掌握泛型的使用。一、泛型的基本概念1.什么是泛型?泛型是JavaSE5引入的一种特性,它允许我们在编译时指定类型参数,从而避免在运行时进行
- git基本使用方法
他们说眼睛也会笑
git基本使用
git基本用法新建远程仓库并克隆到本地关于git库的分支问题版本切换记录自己的第一次博文!(有问题欢迎指正,感谢!)新建远程仓库并克隆到本地gitclone‘url/ssh地址’克隆到本地相应目录下gitadd‘filename’将某个文件添加到暂存区,’.'表示将所有文件添加到暂存区gitcommit-m‘文字描述’提交到版本库gitpush‘将commit的内容推向远程’(如果是第一次试用,需
- Golang笔记—— error 和 panic
haopingbiji
Golang笔记golang开发语言android后端秋招春招开发
大家好,这里是GoodNote,关注公主号:Goodnote,专栏文章私信限时Free。本文详细介绍Golang的两种错误处理机制:error和panic。文章目录Golang的错误处理机制概述`error`特点代码示例基本用法创建`error``panic`特点运行时错误示例`defer`和`recover`的结合使用代码示例基本用法创建`panic``panic`的执行机制`error`和`p
- docker查看正在运行的容器详细教程
黑子哥呢?
运维dockerjava容器
在Docker中,要查看正在运行的容器,可以使用dockerps命令。这个命令会列出当前所有正在运行的容器。以下是具体的用法和一些有用的选项:基本用法dockerps这个命令会显示一个表格,包含以下列:CONTAINERID:容器的唯一标识符。IMAGE:容器使用的镜像。COMMAND:容器启动时执行的命令。CREATED:容器的创建时间。STATUS:容器的状态,如UpXminutes表示容器已
- Linux中ls、grep、wc、sort、>、|的使用
受命于天既寿永昌
LinuxUbuntulinuxubuntu
本篇主要是简单介绍Linux中ls、grep、wc、sort、>、|的使用、展示代码。ls列出命令ls是用于列出目录内容的命令。它是"list"的缩写,常用于查看当前目录下的文件和子目录。基本用法ls选项目录或文件如果不指定目录或文件,ls会列出当前工作目录的内容。如果指定目录或文件,ls会列出指定路径的内容。常用选项1.**`-l`**:以长格式(详细信息)列出文件和目录 ls-l文件权限硬链
- Python内置函数object()详解
嘻嘻爱编码
Python从入门到放弃python开发语言
Python中的object()函数是一个内置函数,它返回一个新的无特征对象。object是所有类的基类,它提供了所有Python类实例的基本方法。函数定义object()函数不需要任何参数,并且返回一个新的object实例。object()基本用法创建一个新的object实例obj=object()print(obj)#输出类似于:检查object实例print(isinstance(obj,o
- bin()的超详细最全指南
huiyuanzhenduo
python开发语言
在Python中,bin()是一个内置函数,主要用于将整数转换为以0b开头的二进制字符串表示形式。下面将从基本用法、参数说明、使用示例、注意事项等方面详细介绍bin()函数。基本语法pythonbin(x)其中,x是需要转换为二进制字符串的整数,可以是正整数、负整数或零。参数说明x:必须是一个整数类型的对象。如果传入的不是整数,会抛出TypeError异常。使用示例1.转换正整数pythonnum
- CSS3 圆角:实现与优化指南
froginwe11
开发语言
CSS3圆角:实现与优化指南随着网页设计的发展,CSS3圆角已经成为了现代网页设计中不可或缺的元素之一。本文将详细讲解CSS3圆角的基本用法、实现方式以及优化技巧,帮助您在网页设计中更好地运用这一功能。一、CSS3圆角基本用法1.1基本概念CSS3圆角指的是网页元素边角的弯曲程度,通过修改元素的边框属性来实现。在CSS3之前,实现圆角主要依赖于图像处理或JavaScript。1.2选择器CSS3圆
- volatile的底层实现
一个儒雅随和的男子
多线程java并发
前言volatile主要有两个作用:保证可见性和禁止指令重排序。可见性是指当一个线程修改了volatile变量的值,其他线程能立即看到这个修改。禁止重排序是为了避免编译器和处理器对指令的优化导致执行顺序改变,从而引发多线程环境下的问题。如果读者已经知道volatile的基本用法,现在想更深入了解其底层机制。可能是一位Java开发者,正在准备面试,或者在学习多线程编程时遇到了疑问。JVM如何实现vo
- 怎么样才能成为专业的程序员?
cocos2d-x小菜
编程PHP
如何要想成为一名专业的程序员?仅仅会写代码是不够的。从团队合作去解决问题到版本控制,你还得具备其他关键技能的工具包。当我们询问相关的专业开发人员,那些必备的关键技能都是什么的时候,下面是我们了解到的情况。
关于如何学习代码,各种声音很多,然后很多人就被误导为成为专业开发人员懂得一门编程语言就够了?!呵呵,就像其他工作一样,光会一个技能那是远远不够的。如果你想要成为
- java web开发 高并发处理
BreakingBad
javaWeb并发开发处理高
java处理高并发高负载类网站中数据库的设计方法(java教程,java处理大量数据,java高负载数据) 一:高并发高负载类网站关注点之数据库 没错,首先是数据库,这是大多数应用所面临的首个SPOF。尤其是Web2.0的应用,数据库的响应是首先要解决的。 一般来说MySQL是最常用的,可能最初是一个mysql主机,当数据增加到100万以上,那么,MySQL的效能急剧下降。常用的优化措施是M-S(
- mysql批量更新
ekian
mysql
mysql更新优化:
一版的更新的话都是采用update set的方式,但是如果需要批量更新的话,只能for循环的执行更新。或者采用executeBatch的方式,执行更新。无论哪种方式,性能都不见得多好。
三千多条的更新,需要3分多钟。
查询了批量更新的优化,有说replace into的方式,即:
replace into tableName(id,status) values
- 微软BI(3)
18289753290
微软BI SSIS
1)
Q:该列违反了完整性约束错误;已获得 OLE DB 记录。源:“Microsoft SQL Server Native Client 11.0” Hresult: 0x80004005 说明:“不能将值 NULL 插入列 'FZCHID',表 'JRB_EnterpriseCredit.dbo.QYFZCH';列不允许有 Null 值。INSERT 失败。”。
A:一般这类问题的存在是
- Java中的List
g21121
java
List是一个有序的 collection(也称为序列)。此接口的用户可以对列表中每个元素的插入位置进行精确地控制。用户可以根据元素的整数索引(在列表中的位置)访问元素,并搜索列表中的元素。
与 set 不同,列表通常允许重复
- 读书笔记
永夜-极光
读书笔记
1. K是一家加工厂,需要采购原材料,有A,B,C,D 4家供应商,其中A给出的价格最低,性价比最高,那么假如你是这家企业的采购经理,你会如何决策?
传统决策: A:100%订单 B,C,D:0%
&nbs
- centos 安装 Codeblocks
随便小屋
codeblocks
1.安装gcc,需要c和c++两部分,默认安装下,CentOS不安装编译器的,在终端输入以下命令即可yum install gccyum install gcc-c++
2.安装gtk2-devel,因为默认已经安装了正式产品需要的支持库,但是没有安装开发所需要的文档.yum install gtk2*
3. 安装wxGTK
yum search w
- 23种设计模式的形象比喻
aijuans
设计模式
1、ABSTRACT FACTORY—追MM少不了请吃饭了,麦当劳的鸡翅和肯德基的鸡翅都是MM爱吃的东西,虽然口味有所不同,但不管你带MM去麦当劳或肯德基,只管向服务员说“来四个鸡翅”就行了。麦当劳和肯德基就是生产鸡翅的Factory 工厂模式:客户类和工厂类分开。消费者任何时候需要某种产品,只需向工厂请求即可。消费者无须修改就可以接纳新产品。缺点是当产品修改时,工厂类也要做相应的修改。如:
- 开发管理 CheckLists
aoyouzi
开发管理 CheckLists
开发管理 CheckLists(23) -使项目组度过完整的生命周期
开发管理 CheckLists(22) -组织项目资源
开发管理 CheckLists(21) -控制项目的范围开发管理 CheckLists(20) -项目利益相关者责任开发管理 CheckLists(19) -选择合适的团队成员开发管理 CheckLists(18) -敏捷开发 Scrum Master 工作开发管理 C
- js实现切换
百合不是茶
JavaScript栏目切换
js主要功能之一就是实现页面的特效,窗体的切换可以减少页面的大小,被门户网站大量应用思路:
1,先将要显示的设置为display:bisible 否则设为none
2,设置栏目的id ,js获取栏目的id,如果id为Null就设置为显示
3,判断js获取的id名字;再设置是否显示
代码实现:
html代码:
<di
- 周鸿祎在360新员工入职培训上的讲话
bijian1013
感悟项目管理人生职场
这篇文章也是最近偶尔看到的,考虑到原博客发布者可能将其删除等原因,也更方便个人查找,特将原文拷贝再发布的。“学东西是为自己的,不要整天以混的姿态来跟公司博弈,就算是混,我觉得你要是能在混的时间里,收获一些别的有利于人生发展的东西,也是不错的,看你怎么把握了”,看了之后,对这句话记忆犹新。 &
- 前端Web开发的页面效果
Bill_chen
htmlWebMicrosoft
1.IE6下png图片的透明显示:
<img src="图片地址" border="0" style="Filter.Alpha(Opacity)=数值(100),style=数值(3)"/>
或在<head></head>间加一段JS代码让透明png图片正常显示。
2.<li>标
- 【JVM五】老年代垃圾回收:并发标记清理GC(CMS GC)
bit1129
垃圾回收
CMS概述
并发标记清理垃圾回收(Concurrent Mark and Sweep GC)算法的主要目标是在GC过程中,减少暂停用户线程的次数以及在不得不暂停用户线程的请夸功能,尽可能短的暂停用户线程的时间。这对于交互式应用,比如web应用来说,是非常重要的。
CMS垃圾回收针对新生代和老年代采用不同的策略。相比同吞吐量垃圾回收,它要复杂的多。吞吐量垃圾回收在执
- Struts2技术总结
白糖_
struts2
必备jar文件
早在struts2.0.*的时候,struts2的必备jar包需要如下几个:
commons-logging-*.jar Apache旗下commons项目的log日志包
freemarker-*.jar
- Jquery easyui layout应用注意事项
bozch
jquery浏览器easyuilayout
在jquery easyui中提供了easyui-layout布局,他的布局比较局限,类似java中GUI的border布局。下面对其使用注意事项作简要介绍:
如果在现有的工程中前台界面均应用了jquery easyui,那么在布局的时候最好应用jquery eaysui的layout布局,否则在表单页面(编辑、查看、添加等等)在不同的浏览器会出
- java-拷贝特殊链表:有一个特殊的链表,其中每个节点不但有指向下一个节点的指针pNext,还有一个指向链表中任意节点的指针pRand,如何拷贝这个特殊链表?
bylijinnan
java
public class CopySpecialLinkedList {
/**
* 题目:有一个特殊的链表,其中每个节点不但有指向下一个节点的指针pNext,还有一个指向链表中任意节点的指针pRand,如何拷贝这个特殊链表?
拷贝pNext指针非常容易,所以题目的难点是如何拷贝pRand指针。
假设原来链表为A1 -> A2 ->... -> An,新拷贝
- color
Chen.H
JavaScripthtmlcss
<!DOCTYPE HTML PUBLIC "-//W3C//DTD HTML 4.01 Transitional//EN" "http://www.w3.org/TR/html4/loose.dtd"> <HTML> <HEAD>&nbs
- [信息与战争]移动通讯与网络
comsci
网络
两个坚持:手机的电池必须可以取下来
光纤不能够入户,只能够到楼宇
建议大家找这本书看看:<&
- oracle flashback query(闪回查询)
daizj
oracleflashback queryflashback table
在Oracle 10g中,Flash back家族分为以下成员:
Flashback Database
Flashback Drop
Flashback Table
Flashback Query(分Flashback Query,Flashback Version Query,Flashback Transaction Query)
下面介绍一下Flashback Drop 和Flas
- zeus持久层DAO单元测试
deng520159
单元测试
zeus代码测试正紧张进行中,但由于工作比较忙,但速度比较慢.现在已经完成读写分离单元测试了,现在把几种情况单元测试的例子发出来,希望有人能进出意见,让它走下去.
本文是zeus的dao单元测试:
1.单元测试直接上代码
package com.dengliang.zeus.webdemo.test;
import org.junit.Test;
import o
- C语言学习三printf函数和scanf函数学习
dcj3sjt126com
cprintfscanflanguage
printf函数
/*
2013年3月10日20:42:32
地点:北京潘家园
功能:
目的:
测试%x %X %#x %#X的用法
*/
# include <stdio.h>
int main(void)
{
printf("哈哈!\n"); // \n表示换行
int i = 10;
printf
- 那你为什么小时候不好好读书?
dcj3sjt126com
life
dady, 我今天捡到了十块钱, 不过我还给那个人了
good girl! 那个人有没有和你讲thank you啊
没有啦....他拉我的耳朵我才把钱还给他的, 他哪里会和我讲thank you
爸爸, 如果地上有一张5块一张10块你拿哪一张呢....
当然是拿十块的咯...
爸爸你很笨的, 你不会两张都拿
爸爸为什么上个月那个人来跟你讨钱, 你告诉他没
- iptables开放端口
Fanyucai
linuxiptables端口
1,找到配置文件
vi /etc/sysconfig/iptables
2,添加端口开放,增加一行,开放18081端口
-A INPUT -m state --state NEW -m tcp -p tcp --dport 18081 -j ACCEPT
3,保存
ESC
:wq!
4,重启服务
service iptables
- Ehcache(05)——缓存的查询
234390216
排序ehcache统计query
缓存的查询
目录
1. 使Cache可查询
1.1 基于Xml配置
1.2 基于代码的配置
2 指定可搜索的属性
2.1 可查询属性类型
2.2 &
- 通过hashset找到数组中重复的元素
jackyrong
hashset
如何在hashset中快速找到重复的元素呢?方法很多,下面是其中一个办法:
int[] array = {1,1,2,3,4,5,6,7,8,8};
Set<Integer> set = new HashSet<Integer>();
for(int i = 0
- 使用ajax和window.history.pushState无刷新改变页面内容和地址栏URL
lanrikey
history
后退时关闭当前页面
<script type="text/javascript">
jQuery(document).ready(function ($) {
if (window.history && window.history.pushState) {
- 应用程序的通信成本
netkiller.github.com
虚拟机应用服务器陈景峰netkillerneo
应用程序的通信成本
什么是通信
一个程序中两个以上功能相互传递信号或数据叫做通信。
什么是成本
这是是指时间成本与空间成本。 时间就是传递数据所花费的时间。空间是指传递过程耗费容量大小。
都有哪些通信方式
全局变量
线程间通信
共享内存
共享文件
管道
Socket
硬件(串口,USB) 等等
全局变量
全局变量是成本最低通信方法,通过设置
- 一维数组与二维数组的声明与定义
恋洁e生
二维数组一维数组定义声明初始化
/** * */ package test20111005; /** * @author FlyingFire * @date:2011-11-18 上午04:33:36 * @author :代码整理 * @introduce :一维数组与二维数组的初始化 *summary: */ public c
- Spring Mybatis独立事务配置
toknowme
mybatis
在项目中有很多地方会使用到独立事务,下面以获取主键为例
(1)修改配置文件spring-mybatis.xml <!-- 开启事务支持 --> <tx:annotation-driven transaction-manager="transactionManager" /> &n
- 更新Anadroid SDK Tooks之后,Eclipse提示No update were found
xp9802
eclipse
使用Android SDK Manager 更新了Anadroid SDK Tooks 之后,
打开eclipse提示 This Android SDK requires Android Developer Toolkit version 23.0.0 or above, 点击Check for Updates
检测一会后提示 No update were found
 23x
23x