干货:如何十分钟实现一个简单的前端性能、fetch请求实时监控?

最近在系统学习分布式微服务架构,最后的技术冲刺
今天的文章因为年前一个朋友问题开始:
如何实时监控fetch请求,因为他想写一个谷歌浏览器的插件,实时监控原生fetch请求,众所周知,fetch源码是将原生ajax封装在内的,网上有一种办法是重写fetch,然后达到效果
对于这种操作我肯定是拒绝的,于是就全面研究了一下前端性能监控,最终还是找到了办法
首先要知道performance的API 我们从最简单的开始
我们查看 performance.timing 会得到下面这些数据
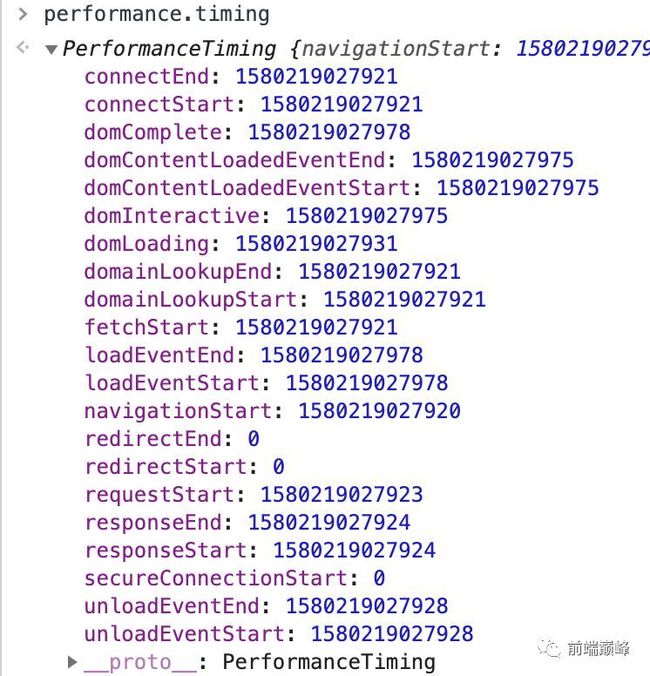
我们把上面的这个数据对象,传入到组装数据的函数内部即可:
下面都有详细的注释,看代码复制就能用,当然SPA页面的监控可能要定制精细化处理,这里就不详细讲了。
// 处理数据
function handleData(performance) {
let navigationStart = performance.navigationStart || performance.fetchStart
let performanceData = {}
if (performance) {
// 重定向时间
            performanceData.redirectTime = performance.redirectEnd - performance.redirectStart
// 缓存时间
            performanceData.cacheTime = performance.domainLookupStart - performance.fetchStart
// dns查询时间
            performanceData.dnsTime = performance.domainLookupEnd - performance.domainLookupStart
// tcp握手时间
            performanceData.TcpTime = performance.connectEnd - performance.connectStart
// ajax请求时间
            performanceData.ajaxTime = performance.responseEnd - performance.requestStart
// 开始解析dom时间,此时document.readyState 变为 loading
            performanceData.domLoadingTime = performance.domLoading ? performance.domLoading - navigationStart : null
// dom解析完成时间,此时document.readyState 变为 interactive
            performanceData.domInteractiveTime = performance.domInteractive - navigationStart
// dom解析完成,资源加载完成,脚本完成
            performanceData.domContentLoadedEventEndTime = performance.domContentLoadedEventEnd - navigationStart
// 页面从开始到结束的全部时间时间
            performanceData.loadPageTime = performance.loadEventEnd ? performance.loadEventEnd - navigationStart : null
        }
return performanceData
    }
组装好数据后,在window.onload事件触发时发送:
 window.onload = function () {
                let timing = window.performance.timing;
                let performanceData = handleData(timing)
                performanceData.timestamp = Date.now()
                performanceData.url = location.href
                performanceData.from = 'window.performance'
                performanceData = Object.assign({}, performanceData, getPaintTime())
                send(performanceData)
            }
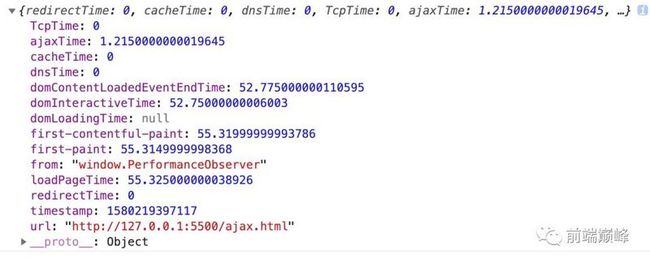
最终上报发送组装好的数据:
那么问题来了,如何事实监控fetch请求呢?那么必定有事件,而且是观察者模式
这里要用到PerformanceObserver这个API
MDN介绍:PerformanceObserver用于监测性能度量事件,在浏览器的性能时间轴记录下一个新的performance entries 的时候将会被通知
PerformanceObserver.observe()
指定监测的 entry types 的集合。当 performance entry 被记录并且是指定的 entryTypes 之一的时候,性能观察者对象的回调函数会被调用
我们在构造调用PerformanceObserver的时候,传入一个函数
perf_observer
制定entryTypes为resource,当我们发送fetch请求的时候,perf_observer
函数就会被调用
function perf_observer(list, observer) {
console.log(list, observer, 'resource', performance.getEntries())
    }
perf_observer函数:
function perf_observer(list, observer) {
console.log(list, observer, 'resource', performance.getEntries())
}
当发送fetch请求时,看打印结果:
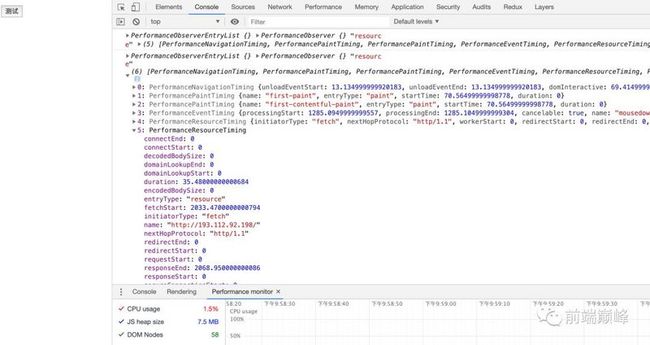
这样每次发送fetch请求,然后我们打印 performance.getEntries()的结果,就可以看到fetch请求了,当然,这里可以写一个diff算法,缓存一份结果,给每一个请求独一无二的key值,每次fetch请求触发perf_observer函数时候,只取出最新的、之前没有的值上报即可
虽然不是什么高深的知识点,但还算比较实用,觉得不错可以点个在看,看得懂源码的人会自己去看,看不懂的你写了也不会看。写文章挺尴尬

长按二维码关注我们
有趣的内容在等你
个人weixin:CALASFxiaotan