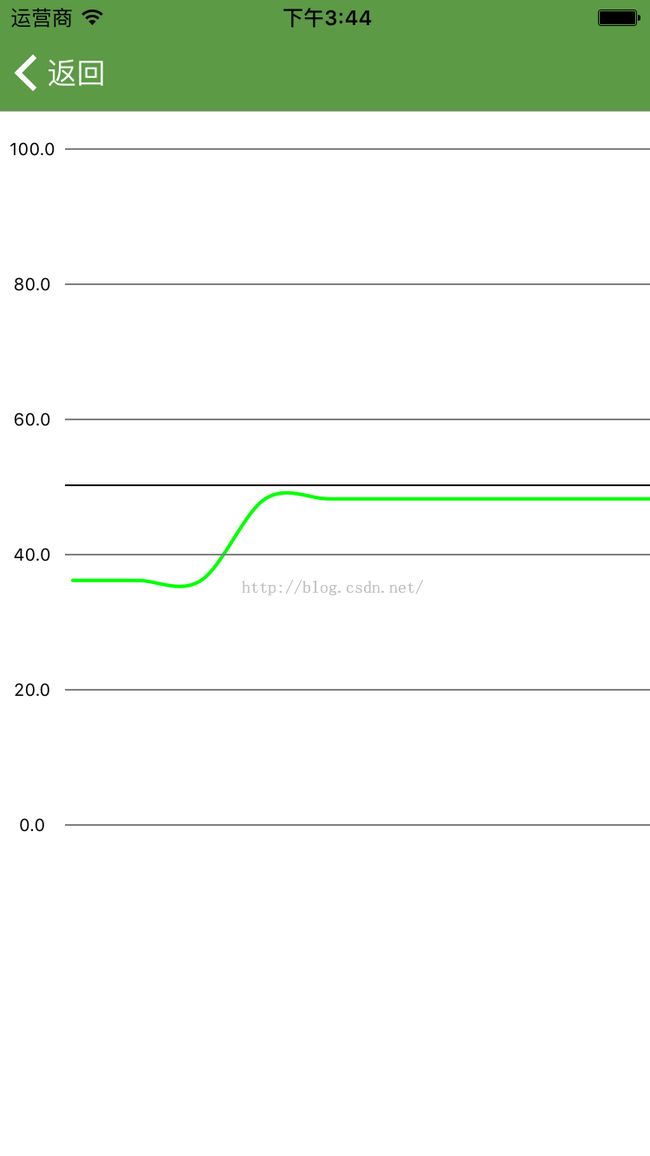
最近接到一个需求,需要iOS设备实时获取服务器的数据,并动态显示在图表中。
主要工作有以下几点:1、写一个轮询,每隔一段时间就从服务器获取数据;2、根据获取到的数据显示在图表中。
1、轮询操作:
轮询的方法很多,比如通过NSthread起个线程,并在子线程中循环请求服务数据,通过GCD的定时器也可以实现,本文采用的是通过RunLoop的形式,RunLoop的优势大家可以百度下。不过这些都不是最优方法,最好的是通过websocket。
话不多说,直接上代码吧。
runLoop模块:
新建图表显示的控制器类:DeviceChartViewController
-(void)myRunloop
{
[NSThread detachNewThreadSelector:@selector(newThreadFun) toTarget:self withObject:nil];
}
-(void)newThreadFun
{
@autoreleasepool {
end =NO;
NSRunLoop * myRunLoop =[NSRunLoop currentRunLoop];
CFRunLoopObserverContext context = {0,CFBridgingRetain(self),NULL,NULL,NULL};
CFRunLoopObserverRef observer = CFRunLoopObserverCreate(kCFAllocatorDefault, kCFRunLoopAllActivities, YES, 0, &myRunLoopObserver, &context);
if (observer) {
CFRunLoopRef cfRunloop = [myRunLoop getCFRunLoop];
CFRunLoopAddObserver(cfRunloop, observer, kCFRunLoopDefaultMode);
}
[NSTimer scheduledTimerWithTimeInterval:3 target:self selector:@selector(timerprocess) userInfo:nil repeats:YES];
while (!end) {
[myRunLoop runUntilDate:[NSDate dateWithTimeIntervalSinceNow:3.0]];
}
}
}
-(void)timerprocess{
ESPCNetworkDeviceDetailRequest *request = [[MyRequest alloc] init];
[self request:request];
}
void myRunLoopObserver(CFRunLoopObserverRef observer,CFRunLoopActivity activity,void* info)
{
switch (activity) {
case kCFRunLoopEntry:
NSLog(@"run loop entry");
break;
case kCFRunLoopBeforeTimers:
NSLog(@"run loop before times");
break;
case kCFRunLoopBeforeSources:
NSLog(@"run loop before sources");
break;
case kCFRunLoopBeforeWaiting:
NSLog(@"run loop before waiting");
break;
case kCFRunLoopAfterWaiting:
NSLog(@"run loop after waiting");
break;
case kCFRunLoopExit:
NSLog(@"run loop exit");
break;
default:
break;
}
}
请求后的结果处理:
- (void)NetworkDidFinishLoad:(NetworkProvider *)provider
{
if (provider == myProvider) {
_dRep = myProvider.torResponse;
if ([_dRep.code isEqualToString:@"1"]) {
NSDictionary *dict = _dRep.detailInfoDict;
NSNumber * statusvalue;
statusvalue = [dict objectForKey:@"statusValue"];
[self.lineChart addPoint:statusvalue.floatValue]; //图表处理函数
}
}
}
- (void)espcNetwork:(TORBaseNetworkProvider *)provider didFailLoadWithError:(NSError *)error
{
if (provider == _deviceDetailProvider) {
[self hideHUD];
_dRep = (ESPCNetworkDeviceDetailResponse*)_deviceDetailProvider.torResponse;
NSString*msg = @"没有获取到数据,请稍后重试!";
if (_dRep&&_dRep.msg) {
msg = _dRep.msg;
}
}
}
2、图表处理
新建一个UIView的类DSGraphChart
//
// DSGraphChart.h
//
// Created by icarus on 15/11/27.
// Copyright © 2015年 icarus. All rights reserved.
//
#import
@interface DSGraphChart : UIView{
UIColor *strokeColor;
UIColor *zeroLinestrokeColor;
UIColor * unitLinestrokeColor;
int strokeLineWidth;
int zeroLineWidth;
int unitLineWidth;
NSMutableArray * pointsArray;
double ymax;
double ymin;
double defaultValue;
int ValueNum;
int unitNum;
NSInteger chartHeight;
NSInteger chartWidth;
int topOffset;
}
-(void)addPoint:(float)pointvalue;
-(void)setPoints:(float)value;
-(void)setDefaultVaule:(float)value;
@end
//
// DSGraphChart.m
// Created by icarus on 15/11/27.
// Copyright © 2015年 icarus. All rights reserved.
//
#import "DSGraphChart.h"
@implementation DSGraphChart
-(id)initWithFrame:(CGRect)frame
{
if (self=[super initWithFrame:frame]) {
ymax =100.0;
ymin =0.0;
[self setBackgroundColor:[UIColor whiteColor]];
strokeLineWidth = 2 ;
zeroLineWidth = unitLineWidth =1;
strokeColor = [UIColor greenColor];
zeroLinestrokeColor = [UIColor blackColor];
unitLinestrokeColor = [UIColor grayColor];
defaultValue =50;
ValueNum =10;
unitNum = 5;
pointsArray =[[NSMutableArray alloc] init];
for (int i=0; i
[pointsArray addObject:[NSNumber numberWithFloat:defaultValue]];
}
topOffset =8;
chartHeight = self.frame.size.height-topOffset;
for (int i=0; i<=unitNum; i++) {
NSInteger labelHeght =10;
UILabel * label = [[UILabel alloc] initWithFrame:CGRectMake(0, self.frame.size.height-chartHeight/unitNum*i-topOffset/2-labelHeght/2, self.frame.size.width/ValueNum, labelHeght)];
[label setText:[NSString stringWithFormat:@"%1.1f",(ymax-ymin)/unitNum*i]];
[label setTextAlignment:NSTextAlignmentCenter];
[label setFont:[UIFont systemFontOfSize:10.0f]];
[self addSubview:label];
}
}
return self;
}
-(void)setDefaultVaule:(float)value
{
defaultValue =value;
[self setNeedsDisplay];
}
-(void)setPoints:(float)value
{
[pointsArray removeAllObjects];
for (int i=0; i
[pointsArray addObject:[NSNumber numberWithFloat:value]];
}
[self setNeedsDisplay];
}
-(void)addPoint:(float)pointvalue
{
[pointsArray insertObject:@(pointvalue) atIndex:0];
[pointsArray removeObjectAtIndex:[pointsArray count] - 1];
[self setNeedsDisplay];
}
- (NSArray*)arrayOfPoints {
NSMutableArray *points = [NSMutableArray array];
int viewWidth = CGRectGetWidth(self.frame);
int viewHeight = CGRectGetHeight(self.frame);
for (int i = 0; i < [pointsArray count]; i++) {
float point1x = viewWidth - (viewWidth / ValueNum) * i;
float point1y = (viewHeight - (chartHeight / (ymax-ymin)) * [pointsArray[i] floatValue])-topOffset/2;
CGPoint p;
p = CGPointMake(point1x, point1y);
[points addObject:[NSValue valueWithCGPoint:p]];
}
return points;
}
// Only override drawRect: if you perform custom drawing.
// An empty implementation adversely affects performance during animation.
- (void)drawRect:(CGRect)rect {
// Drawing code
NSMutableArray *points = [[self arrayOfPoints] mutableCopy];
// Add control points to make the math make sense
[points insertObject:points[0] atIndex:0];
[points addObject:[points lastObject]];
UIBezierPath *lineGraph = [UIBezierPath bezierPath];
[lineGraph moveToPoint:[points[0] CGPointValue]];
for (NSUInteger index = 1; index < points.count - 2; index++)
{
CGPoint p0 = [(NSValue *)points[index - 1] CGPointValue];
CGPoint p1 = [(NSValue *)points[index] CGPointValue];
CGPoint p2 = [(NSValue *)points[index + 1] CGPointValue];
CGPoint p3 = [(NSValue *)points[index + 2] CGPointValue];
float granularity=20.0;
// now add n points starting at p1 + dx/dy up until p2 using Catmull-Rom splines
for (int i = 1; i < granularity; i++)
{
float t = (float) i * (1.0f / (float) granularity);
float tt = t * t;
float ttt = tt * t;
CGPoint pi; // intermediate point
pi.x = 0.5 * (2*p1.x+(p2.x-p0.x)*t + (2*p0.x-5*p1.x+4*p2.x-p3.x)*tt + (3*p1.x-p0.x-3*p2.x+p3.x)*ttt);
pi.y = 0.5 * (2*p1.y+(p2.y-p0.y)*t + (2*p0.y-5*p1.y+4*p2.y-p3.y)*tt + (3*p1.y-p0.y-3*p2.y+p3.y)*ttt);
[lineGraph addLineToPoint:pi];
}
[lineGraph addLineToPoint:p2];
}
[lineGraph addLineToPoint:[(NSValue *)points[(points.count - 1)] CGPointValue]];
[strokeColor setStroke];
lineGraph.lineCapStyle = kCGLineCapRound;
lineGraph.lineJoinStyle = kCGLineJoinRound;
lineGraph.flatness = 0.5;
lineGraph.lineWidth = strokeLineWidth; // line width
[lineGraph stroke];
[zeroLinestrokeColor setStroke];
UIBezierPath *zeroLine = [UIBezierPath bezierPath];
[zeroLine moveToPoint:CGPointMake(self.frame.size.width/ValueNum, self.frame.size.height/2)];
[zeroLine addLineToPoint:CGPointMake(self.frame.size.width, self.frame.size.height/2)];
zeroLine.lineWidth = zeroLineWidth; // line width
[zeroLine stroke];
[unitLinestrokeColor setStroke];
for (int i=0; i<=unitNum; i++) {
UIBezierPath *unitLine = [UIBezierPath bezierPath];
[unitLine moveToPoint:CGPointMake(self.frame.size.width/ValueNum, self.frame.size.height-chartHeight/unitNum*i-topOffset/2)];
[unitLine addLineToPoint:CGPointMake(self.frame.size.width, self.frame.size.height-chartHeight/unitNum*i-topOffset/2)];
unitLine.lineWidth = unitLineWidth;
[unitLine stroke];
}
}
@end
在DeviceChartViewController初始化图表类并动态显示:
//
// DeviceChartViewController.h
// ESPC-M-HD
//
// Created by icarus on 15/11/26.
// Copyright © 2015年 icarus. All rights reserved.
//
#import
@interface DeviceChartViewController : UIViewController
{
BOOL end;
}
@property (nonatomic,strong) NSString* charttitle;
@property (nonatomic,strong) NSString* statusName;
@property (nonatomic,strong) NSString* device_hash;
@property (nonatomic,strong) NSNumber* defaultValue;
@end
- (void)viewDidLoad {
[super viewDidLoad];
// Do any additional setup after loading the view.
valueArray = [[NSMutableArray alloc] init];
[self.view addSubview:self.lineChart];
}
-(void)viewDidAppear:(BOOL)animated
{
[super viewDidAppear:YES];
[self myRunloop];
}
-(void)viewWillDisappear:(BOOL)animated
{
[super viewWillDisappear:YES];
end =YES;
}
-(DSGraphChart *)lineChart{
if (!_lineChart) {
_lineChart = [[DSGraphChart alloc] initWithFrame:CGRectMake(0, 80, self.view.bounds.size.width, 400)];
[_lineChart setPoints:self.defaultValue.floatValue];
}
return _lineChart;
}
最终展示的效果:
主要说下一个坑:那就是UIView的drawrext重绘机制,刚开始做的时候,随着数据的动态变化,uiview重绘后没有清除之前的图形,导致出现了多条曲线,看遍代码找不到问题出在哪里,后来无意中发现,是没有设置uiview的backgroundColor,设置了之后就不会出现了。
