首先感谢我的师兄 HJ,我的所有资源,学习方式以及薅 Google/Github的羊毛都是在师兄的指导下完成的。
同时为了帮助师弟,师妹,我的同学们快速的使用 latex 写作,决定写下这个基础教程,也把从师兄那里学来的东西分享给大家。
我使用过 latex线上编译 overleaf 以及 本地编译 TexStudio,希望我的经验能够对大家有所帮助。
overleaf
overleaf 的方便在于能够显示编译,只有有网就行,但是网速限制了它的使用(特别是在寝室的渣渣网速下)
overleaf 的打开方式:https://www.overleaf.com/
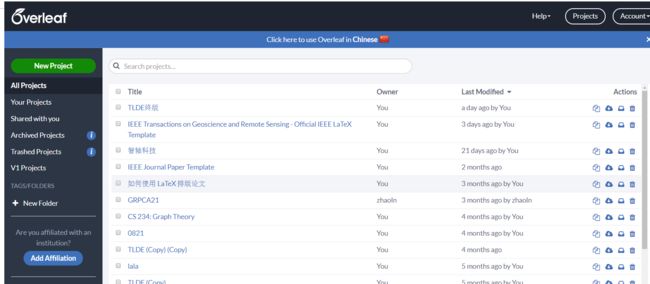
界面如下:
然后注册即可,建议是在机房的电脑上注册(能够使用IPV6),寝室的网可能进不去这个界面,我使用的是163邮箱注册。
进入后的界面如下:
写文章的时候可以使用 overleaf 里面给的模板,也可以自己上传模板。
使用 overleaf 里的模板
点击 New Project ,选择你想使用的模板类型
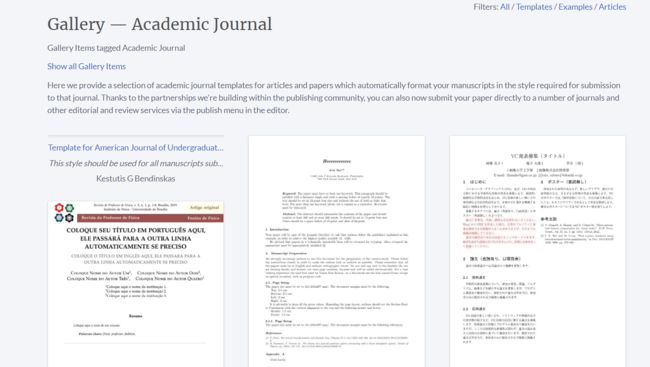
如 Academic Joural:
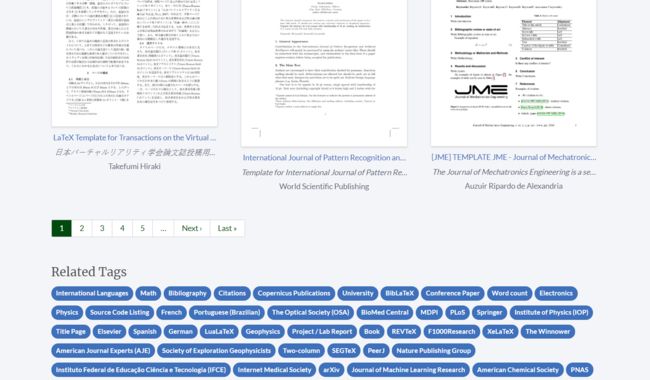
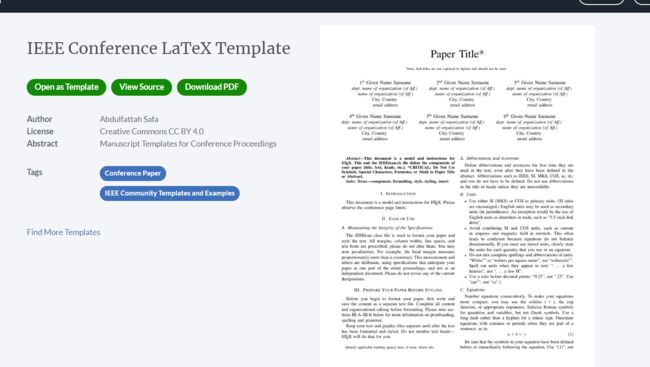
我基本看的是 IEEE 的文章, 我就在 Related Tags 里面找 IEEE的,点击即可。
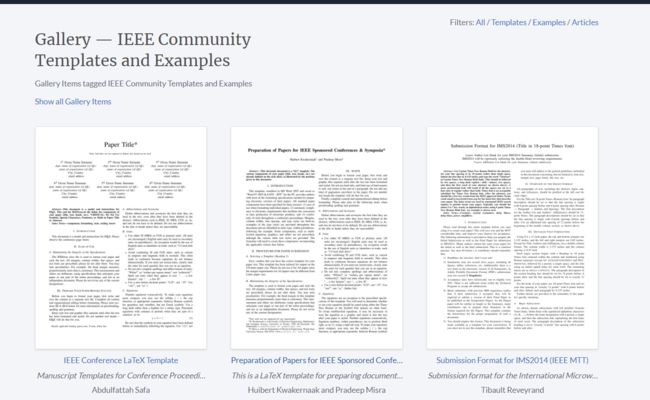
点击之后的界面如下:
这里我们选择第一个点开,
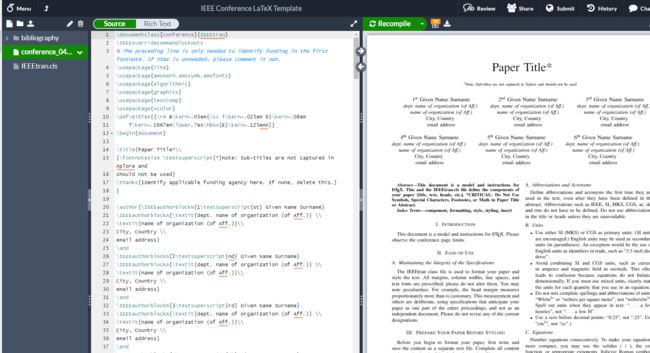
接着点击 Open as Template 就创建成功了。
TexStudio
首先下载 TexStudio 和 Texlive。
TexStudio 下载地址:https://www.texstudio.org/
点击 Download now 即可。
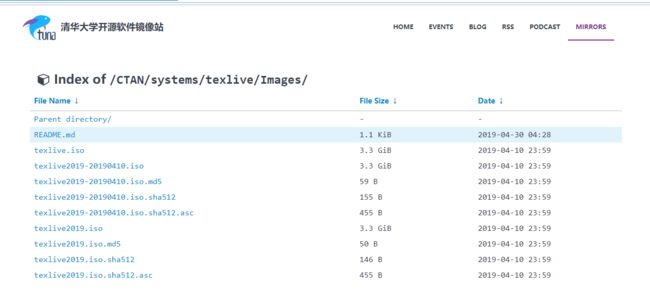
TexLive 建议用清华镜像下载:https://mirrors.tuna.tsinghua.edu.cn/CTAN/systems/texlive/Images/
TexLive 的安装教程如下:https://blog.csdn.net/aiwei169/article/details/81431363
懒得自己写了。
准备工作完成,接下来写 Latex 的写法。
overleaf 和 TexStudio 的里面的写法是一样的。
Latex 符号大全
诸如:这些特殊字符,请参考:https://wenku.baidu.com/view/b1ad1658bb68a98271fefaa1.html?re=view
Latex 插入公式
只要使用了正确的公式编写方式,公式会自动编号为(1),(2),.... ,(n) 的,所以不需要担心公式编号问题。
基本写法框架如下:
\begin{equation}\label{eq.1}

\end{equation}
这里 \label{eq.1} 是为了方便在文章引入该公式。
举个例子:
上述的计算公式如 Eq. \ref{eq.1}所示。
这里的 \ref{eq.1} 就是为了引用改公式, 当然你给 label 取名为 lalala 也许,只要你引用的时候在 \ref{} 里面的和你取名是对应的就 ok。
普通函数公式
\begin{equation}\label{equ:7}
\begin{split}
    C_{i} &= {1\over S-1}\sum_{s=1}^{S} (x_{s}-\mu _{i})(x_{s}-\mu _{i})^{T}\\
    \mu _i &= {1\over S}\sum_{s=1}^{s} x_{s}
\end{split}
\end{equation}
这里的 split 是对齐的意思, 让两行公式在 & 的地方对齐,并且 \\ 是换行的意思。
分段函数公式
要完成上述公式的 Latex 代码如下:
\begin{equation}\label{equ:4}
    w_{ij} =
    \begin{cases}
    exp(-||x_{i} - x_{j}||^{2} / t) & \text{$x_{j}\in O(K, x_{i})$}
    \\
    &\text{or $x_{i}\in O(K, x_{j})$}
    \\
    &\text{and $y_{i} = y_{j}$};
    \\
    0 &\text{otherwise}
    \end{cases}
\end{equation}
优化函数公式
\begin{equation}\label{equ:13}
    \begin{split}
        J&(P) = \mathop{\arg}\min_P \sum_{i,j}||P^{T}x_{i}-P^{T}x_{j}||^{2}w_{var}\;_{ij}\\
        &\;s.t.\;\;\sum_{ij}||P^{T}x_{i}-P^{T}x_{j}||^{2}w'_{cov}\;_{ij}=1
    \end{split}
\end{equation}
这里 \; 是让公式里空一个字符的意思
可以参考这个 Latex 在线编辑公式(虽然个人不喜欢用),链接如下:
https://latex.91maths.com/
Latex 插入表格
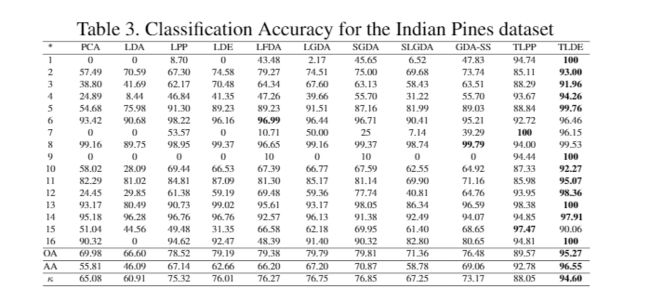
在 Latex 中想要插入如下的一个表格,需要怎么做呢?
\begin{table*}[htbp]
\small
  \caption{Classification Accuracy for the Indian Pines dataset}
  \label{tbl:example}
  \centering
  \scalebox{0.5}{
  \begin{tabular*}{\textwidth}{@{\extracolsep{\fill}}cccccccccccc}
    \hline
    * & PCA & LDA & LPP & LDE & LFDA & LGDA & SGDA & SLGDA & GDA-SS & TLPP &TLDE \\
    \hline
    1 &  0 & 0 & 8.70 & 0 & 43.48 & 2.17 & 45.65 & 6.52 & 47.83 & 94.74 &\textbf{100 }\\
    2 &  57.49 & 70.59 & 67.30 & 74.58 & 79.27 & 74.51 & 75.00 & 69.68 & 73.74 & 85.11 &\textbf{93.00} \\
    3 &  38.80 & 41.69 & 62.17 & 70.48 & 64.34 & 67.60 & 63.13 & 58.43 & 63.51 & 88.29 &\textbf{91.96 }\\
    4 &  24.89 & 8.44 & 46.84 & 41.35 & 47.26 & 39.66 & 55.70 & 31.22 & 55.70 & 93.67 &\textbf{94.26} \\
    5 &  54.68 & 75.98 & 91.30 & 89.23 & 89.23 & 91.51 & 87.16 & 81.99 & 89.03 & 88.84 &\textbf{99.76} \\
    6 &  93.42 & 90.68 & 98.22 & 96.16 & \textbf{96.99} & 96.44 & 96.71 & 90.41 & 95.21 & 92.72 & 96.46 \\
    7 &   0 & 0 & 53.57 & 0 & 10.71 & 50.00 & 25 & 7.14 & 39.29 & \textbf{100} & 96.15 \\
    8 &  99.16 & 89.75 & 98.95 & 99.37 & 96.65 & 99.16 & 99.37 & 98.74 & \textbf{99.79} & 94.00 &99.53 \\
    9 &  0 & 0 & 0 & 0 & 10 & 0 & 10 & 0 & 0 & 94.44 &\textbf{100 }\\
    10 &  58.02 & 28.09 & 69.44 & 66.53 & 67.39 & 66.77 & 67.59 & 62.55 & 64.92 & 87.33 &\textbf{92.27} \\
    11 &  82.29 & 81.02 & 84.81 & 87.09 & 81.30 & 85.17 & 81.14 & 69.90 & 71.16 & 85.98 &\textbf{95.07} \\
    12 &  24.45 & 29.85 & 61.38 & 59.19 & 69.48 & 59.36 & 77.74 & 40.81 & 64.76 & 93.95 &\textbf{98.36} \\
    13 &   93.17 & 80.49 & 90.73 & 99.02 & 95.61 & 93.17 & 98.05 & 86.34 & 96.59 & 98.38 &\textbf{100} \\
    14 &  95.18 & 96.28 & 96.76 & 96.76 & 92.57 & 96.13 & 91.38 & 92.49 & 94.07 & 94.85 &\textbf{ 97.91} \\
    15 &  51.04 & 44.56 & 49.48 & 31.35 & 66.58 & 62.18 & 69.95 & 61.40 & 68.65 & \textbf{97.47} &90.06 \\
    16 &  90.32 & 0 & 94.62 & 92.47 & 48.39 & 91.40 & 90.32 & 82.80 & 80.65 & 94.81 &\textbf{100} \\
    \hline
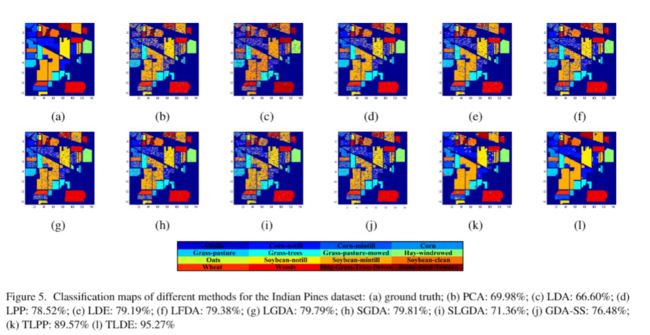
    OA &   69.98 & 66.60 & 78.52 & 79.19 & 79.38 & 79.79 & 79.81 & 71.36 & 76.48 & 89.57 &\textbf{95.27} \\
    \hline
    AA &  55.81 & 46.09 & 67.14 & 62.66 & 66.20 & 67.20 & 70.87 & 58.78 & 69.06 & 92.78 &\textbf{96.55} \\
    \hline
    \kappa &  65.08 & 60.91 & 75.32 & 76.01 & 76.27 & 76.75 & 76.85 & 67.25 & 73.17 & 88.05 &\textbf{94.60} \\
    \hline
  \end{tabular*}}
\end{table*}
其中 \begin{table}中的 * 号是让表格跨双栏的意思,因为有些文章的格式是双栏的。\small 是控制里面的字体大小(还可以使用 \large,\normalsize 之类的),\label{} 和公式里的效果一样,\centering 让里面的字居中, \scalebox{0.5}{table} 让里面的 table 放缩0.5倍。
然后里面的table用 \begin{tabular}开始写,
接着\begin{tabular}{cccccccccccc} 其中 c 的个数表示有多少列。
\hline 是画横线的意思
& 是对齐的意思
\\ 是换行的意思
Latex 插入图片
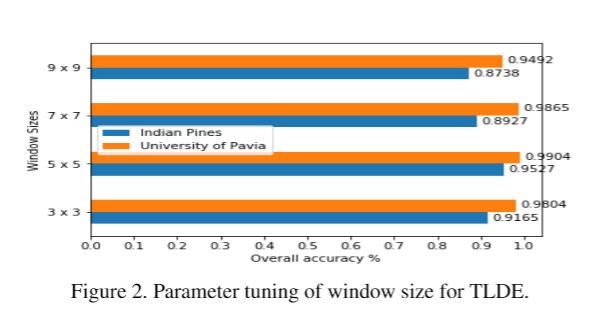
插入一个图片
\begin{figure}[htbp]
  \centering
  \includegraphics[width=\linewidth,height=3.5cm]{windowsiez.png} 文件的相对路径
  \caption{Parameter tuning of window size for TLDE.} %caption是图片的标题
  \label{fig3}
\end{figure}
其中 windowsize.png 是你要插入的图片,路劲要和你的 .tex 文件一样。
\width,\height 控制图片的长宽
插入一行两个图片
\begin{figure}[htbp]
\subfigure[]{
      \begin{minipage}{3.9cm}
       \includegraphics[width=\linewidth,height=3.9cm]{OA.png}
       \end{minipage}
       }
       \subfigure[]{
      \begin{minipage}{3.9cm}
       \includegraphics[width=\linewidth,height=3.9cm]{paviawangge.png}
       \end{minipage}
       }
       \caption{The overall accuracy corresponding to different spectral dimension and different spatial dimension for TLDE under the condition of window size of $5\times 5$: (a) Indian Pines dataset; (b) University of Pavia dataset.}
  \label{fig5}
\end{figure}
\subfigure[] 就是插入子图的意思,这个会自动编号 (a), (b)
其实不是很推荐这样的插入子图的方式。我喜欢用另外一个插入子图的方式,如下节所示。
插入多行多列的图片
\begin{figure*}[htbp]
\begin{center}

\begin{tabular}{cccccc}
   \includegraphics[width=2.5cm,height=2.5cm]{PTLDE-gt.png} &
     \includegraphics[width=2.5cm,height=2.5cm]{PTLDE-PCA.png} &
    \includegraphics[width=2.5cm,height=2.5cm]{PTLDE-LDA.png} &
    \includegraphics[width=2.5cm,height=2.5cm]{PTLDE-LPP.png} &
   \includegraphics[width=2.5cm,height=2.5cm]{PTLDE-LDE.png} &
   \includegraphics[width=2.5cm,height=2.5cm]{PTLDE-LFDA.png} \\
   (a) & (b) & (c) & (d) & (e) & (f)\\
   \includegraphics[width=2.5cm,height=2.5cm]{PTLDE-LGDA.png} &
    \includegraphics[width=2.5cm,height=2.5cm]{PTLDE-SGDA.png} &
    \includegraphics[width=2.5cm,height=2.5cm]{PTLDE-SLGDA.png} &
    \includegraphics[width=2.5cm,height=2.5cm]{PTLDE-GDA_SS.png} &
       \includegraphics[width=2.5cm,height=2.5cm]{TLPP_pavia.png} &
    \includegraphics[width=2.5cm,height=2.5cm]{PTLDE-TLDE.png} \\
  (g) & (h) & (i) & (j) & (k) & (l)
  \end{tabular}
  \scalebox{0.5}{
  \begin{tabular}{c}
    \includegraphics[width=\linewidth]{pavialegend.png}
\end{tabular}}
\end{center}
\caption{\label{fig:pavia gt}
Classification maps of different methods for the University of Pavia dataset: (a) ground truth; (b) PCA: 90.00\%; (c) LDA: 87.49\%; (d) LPP: 90.61\%; (e) LDE: 93.99\%; (f) LFDA: 94.08\%; (g) LGDA: 93.32\%; (h) SGDA: 94.16\%; (i) SLGDA: 92.69\%; (j): GDA-SS: 92.72\%; (k) TLPP: 88.68\%; (l) TLDE: 99.04\%}
\end{figure*}
我喜欢这样的编写子图的形式,类似于写表格。
Latex 参考文献
方法1
\begin{thebibliography}{99}

\bibitem{c14}
Gao L, Yang B, Du Q, et al. Adjusted spectral matched filter for target detection in hyperspectral imagery[J]. Remote Sensing, 2015, 7(6): 6611-6634.
\end{thebibliography}
这里的 c14 类似于图片公式里的 \label{} 括号里的东西,都是为了方便引用。
这是我文章里的 Latex 写的片段
Hyperspectral image (HSI) usually consists of hundreds of spectral bands from the visible spectrum to the infrared spectrum \cite{c14}.
编译后的效果如下:
一定要使用 \cite{} 的方式来引用,并且括号里面要避免使用中文。
方法2
使用 .bib 文件来存参考文献
首先新建一个 .txt 文件,然后另存为 .bib 文件。
操作如下:
需要注意的是这里保存类型一定要选择所有文件。
然后得到这样一个 .bib 文件
接着把 new.bib 文件和 .tex 文件放在一个目录下。
然后用 TexStudio 打开 .tex 文件,需要做一定的修改。在 \end{document}之前加上,\bibliographystyle{IEEEtran},\bibliography{new}
其中 \bibliographystyle{IEEEtran}是参考文献的风格, \bibliography{new}是你文章的参考文献。
接着使用 Google 学术镜像,网站如下:https://ac.scmor.com/
随意点击一个进行访问。
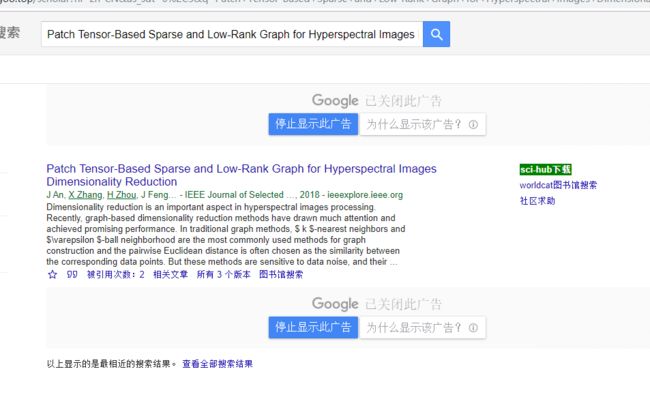
假如需要引用 Patch Tensor-Based Sparse and Low-Rank Graph for Hyperspectral Images Dimensionality Reduction 这篇参考文献,操作如下。
首先输入paper 名字,
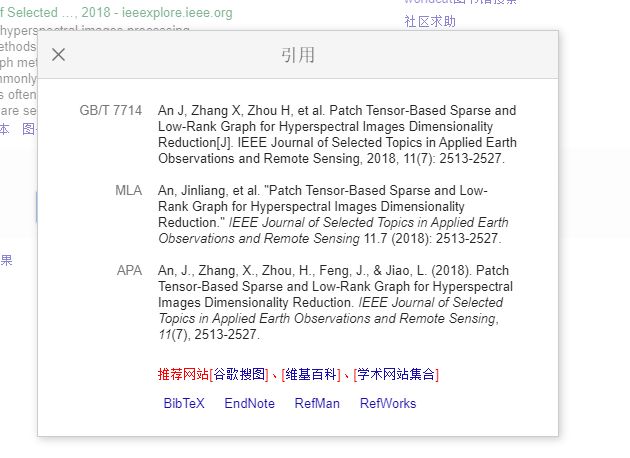
点击下面的 引号 ' '(在被引用次数旁边)
如果使用第一种引用参考文献的方式,直接复制 GB/T 7714 里的内容即可。
如果使用第二种引用参考文献的方式,则需点击左下方的 Bib Tex ,点开之后的界面如下:
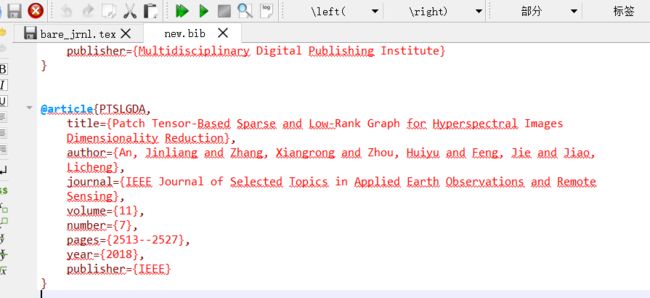
把内容复杂到 new.bib 文件里即可。
这里 @artucle{PTSLGDA} 就是我们的 \cite{} 里面的东西。我喜欢把这里 \cite{} 里的东西改成好些的,比如这里我就把原先的 an2018patch 改成了 PTSLGDA

