1. 引言
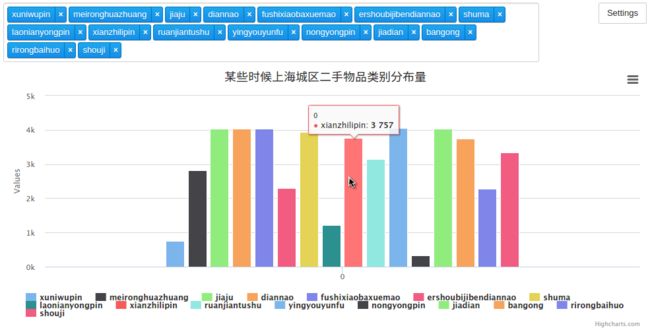
统计赶集网-上海-二手市场16个大类目的发帖量, 并在jupyter-notebook中绘制出各区域发帖量对比的柱状图
2. 分析
- 筛选重复的分类使之唯一
- 分别统计分类出现的次数
- 生成合乎
charts要求格式的字典列表
3. 实现
In [1] :
from pymongo import MongoClient
from string import punctuation
import charts
Server running in the folder /home/wjh at 127.0.0.1:53200
In [2] :
client = MongoClient('10.66.17.17', 27017)
database = client['ganji']
item_info_collection = database['sh_ershou_itemY']
In [3] :
# 包含所有分类的列表
cate_list = [i['cate'][1] for i in item_info_collection.find()]
# 区域名字是唯一的集合
cate_set = set(cate_list)
# 输出看下是什么结果
print(len(cate_set), cate_set)
16 {'xuniwupin', 'meironghuazhuang', 'jiaju', 'diannao', 'fushixiaobaxuemao', 'ershoubijibendiannao', 'shuma', 'laonianyongpin', 'xianzhilipin', 'ruanjiantushu', 'yingyouyunfu', 'nongyongpin', 'jiadian', 'bangong', 'rirongbaihuo', 'shouji'}
In [4] :
# 统计分类出现次数的列表, 如下看到有16个分类
cate_times = [cate_list.count(index) for index in cate_set]
# 输出看下是什么结果
print(len(cate_times), cate_times)
16 [759, 2815, 4040, 4043, 4041, 2302, 3935, 1210, 3757, 3144, 4045, 321, 4041, 3751, 2287, 3335]
In [5] :
# 定义生成图表数据的函数
def cate_data_gen(types):
    length = 0
    # 循环次数为区域集合长度
    if length <= len(area_set):
        for name, time in zip(cate_set, cate_times):
            data = {
                'name': name,
                'data': [time],
                'type': types,
            }
            # 遇到yield语句返回,再次执行时从上次返回的yield语句处继续执行, 所以循环执行就有一个字典列表了
            yield data
# 输出看下是什么结果
[i for i in cate_data_gen('column')]
Out [5] :
[{'data': [759], 'name': 'xuniwupin', 'type': 'column'},
 {'data': [2815], 'name': 'meironghuazhuang', 'type': 'column'},
 {'data': [4040], 'name': 'jiaju', 'type': 'column'},
 {'data': [4043], 'name': 'diannao', 'type': 'column'},
 {'data': [4041], 'name': 'fushixiaobaxuemao', 'type': 'column'},
 {'data': [2302], 'name': 'ershoubijibendiannao', 'type': 'column'},
 {'data': [3935], 'name': 'shuma', 'type': 'column'},
 {'data': [1210], 'name': 'laonianyongpin', 'type': 'column'},
 {'data': [3757], 'name': 'xianzhilipin', 'type': 'column'},
 {'data': [3144], 'name': 'ruanjiantushu', 'type': 'column'},
 {'data': [4045], 'name': 'yingyouyunfu', 'type': 'column'},
 {'data': [321], 'name': 'nongyongpin', 'type': 'column'},
 {'data': [4041], 'name': 'jiadian', 'type': 'column'},
 {'data': [3751], 'name': 'bangong', 'type': 'column'},
 {'data': [2287], 'name': 'rirongbaihuo', 'type': 'column'},
 {'data': [3335], 'name': 'shouji', 'type': 'column'}
In [6] :
# 生成数据
serises = [i for i in cate_data_gen('column')]
# 传入参数并绘制图表
charts.plot(serises, show='inline', options=dict(title=dict(text='某些时候上海城区二手物品类别分布量')))
Out [6] :
4. 总结
-
highcharts:
Highcharts是一款纯javascript编写的图表库,能够很简单便捷的在Web网站或Web应用中添加交互性的图表,Highcharts目前支持直线图、曲线图、面积图、柱状图、饼图、散点图等多达18种不同类型的图表,可以满足你对Web图表的任何需求 !
