Linear-Regression - Shuai-Xie -Github
Part 1: Question
预测在哪个城市开快餐店利润最高
ex1data1.txt (城市人口,快餐店利润)
6.1101,17.592
5.5277,9.1302
8.5186,13.662
7.0032,11.854
5.8598,6.8233
8.3829,11.886
……
Part 2: Plotting data
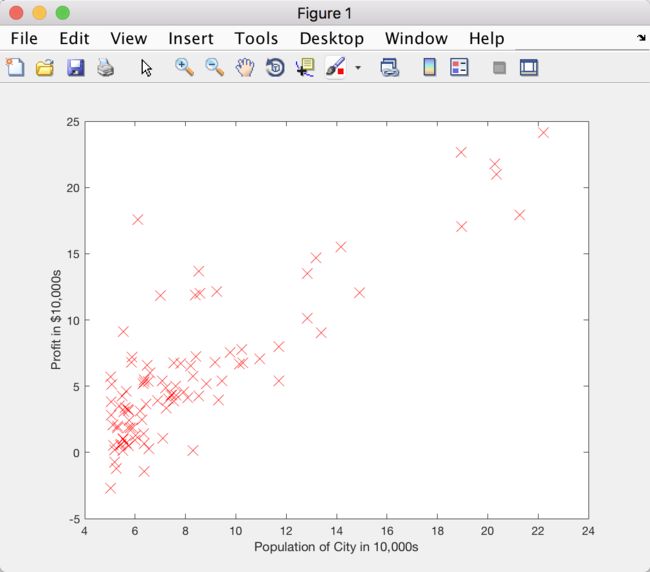
通过散点图可视化数据
%% ======================= Part 2: Plotting data =======================
% 输出样本点散点图
fprintf('Plotting Data ...\n')
data = load('ex1data1.txt'); % 加载数据 csv文件

X = data(:, 1); % X 城市人口 第1列
y = data(:, 2); % y 城市利润 第2列

m = length(y); % 训练集大小

% 调用 plotData 函数做散点图
plotData(X, y);

fprintf('Program paused. Press enter to continue.\n');
pause;
plotData 函数
function plotData(x, y)
% PLOTDATA Plots the data points x and y into a new figure 返回值为空的函数
%   1. plots the data points.
%   2. gives the figure axes labels of population and profit.

figure; % 打开一个空的图片窗口

% 调用 matlab 描点函数 在 figure 打开的窗口上描点
plot(x, y, 'rx', 'MarkerSize', 10); % rx 红十字,10 设置 MarkerSize

% 设置 x, y 轴标签
ylabel('Profit in $10,000s');
xlabel('Population of City in 10,000s');

end
Part 3: Gradient descent
%% =================== Part 3: Gradient descent ===================
fprintf('Running Gradient Descent ...\n')

% 调整样本并初始化一些值
X = [ones(m, 1), data(:,1)]; % 添加 ones(m, 1) 适配 theta0
theta = zeros(2, 1); % theta = [0,0]
iterations = 1500; % 迭代次数
alpha = 0.01; % 学习率

% 初始情况(theta=0)下的 cost
computeCost(X, y, theta);

% 梯度下降法求最优的 theta
theta = gradientDescent(X, y, theta, alpha, iterations);

% 1500次学习后的 theta
fprintf('Theta found by gradient descent: ');
fprintf('%f %f \n', theta(1), theta(2)); % 分别打印,注意matlab下标从1开始

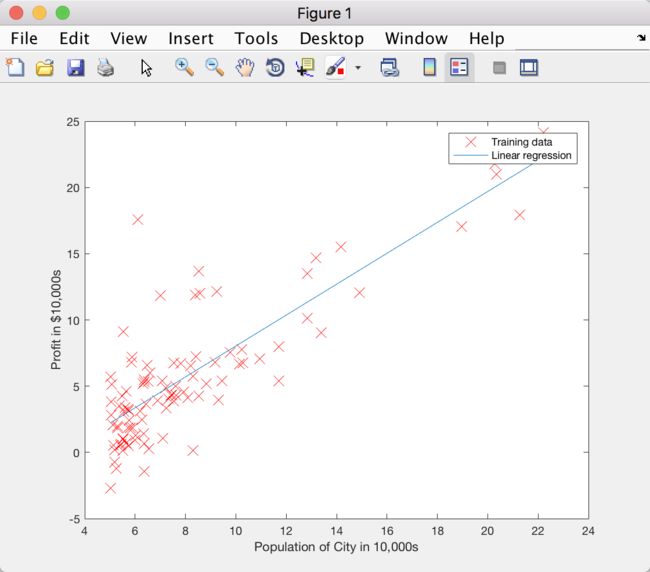
% 在保留散点的基础上 画出 最终theta 确定的 线性方程
hold on; % keep previous plot visible 保留以前的散点
plot(X(:,2), X * theta, '-'); % 用 '-' 表示点,做散点图的时候用的是 'rx'
legend('Training data', 'Linear regression'); % 设置图例分别对应 'rx', '-'
hold off; % not overlay any more plots on this figure 不再画任何点

% 用 theta 预测,城市人口数:35,000 和 70,000
predict1 = [1, 3.5] * theta;
fprintf('For population = 35,000, we predict a profit of %f\n', predict1*10000);

predict2 = [1, 7] * theta;
fprintf('For population = 70,000, we predict a profit of %f\n', predict2*10000);

fprintf('Program paused. Press enter to continue.\n');
pause;
Running Gradient Descent ...

ans =

   32.0727

After the last iteration: J = 4.483388
Theta found by gradient descent: -3.630291 1.166362
For population = 35,000, we predict a profit of 4519.767868
For population = 70,000, we predict a profit of 45342.450129
Program paused. Press enter to continue.
computeCost 函数
function J = computeCost(X, y, theta)

% 初始化一些值
m = length(y); % 训练集数量
J = 0; % cost

for i = 1:m
    J = J + (X(i, :) * theta - y(i))^2;
    % X(i, :)表示第i个实例的特征
    % hθ(xi) = X(i, :) * theta 第i个实例的预测值
end
J = J / (2 * m); % 输出 theta = [0, 0] 求得的 J 值

end
向量表示求和
function J = computeCost(X, y, theta)

% 初始化一些值
m = length(y); % 训练集数量

E = X * theta - y; % 偏差矩阵
J = (E' * E) / (2 * m); % E' * E 平方和

end
gradientDescent 函数
function [theta, J_history] = gradientDescent(X, y, theta, alpha, num_iters)
% X 样本特征,y 样本实际值,theta 模型参数,alpha 学习率,num_iters 迭代次数

% 初始化一些值
m = length(y);
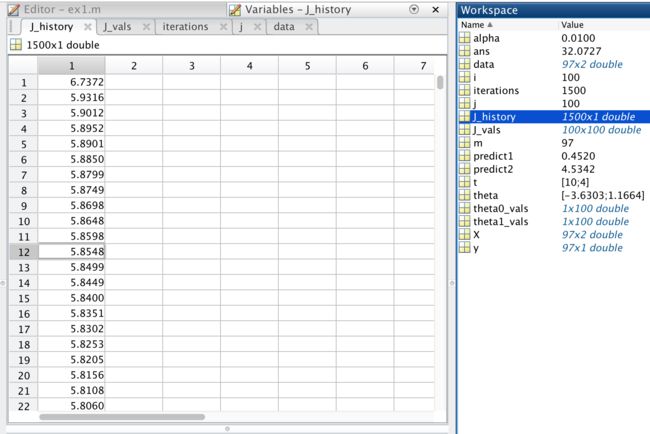
J_history = zeros(num_iters, 1); % 存储每次迭代的J值

for iter = 1:num_iters % 迭代次数

    tmp1 = 0; % 存储求和项
    tmp2 = 0;

    % 计算求和项
    for i = 1:m
        tmp1 = tmp1 + (X(i, :) * theta - y(i)); % theta0 对应 X(i, 1) = 1
        tmp2 = tmp2 + (X(i, :) * theta - y(i)) * X(i, 2);
    end

    % 更新 theta
    theta(1) = theta(1) - alpha * tmp1 / m;
    theta(2) = theta(2) - alpha * tmp2 / m;

    % 保存每次迭代的 J 值
    J_history(iter) = computeCost(X, y, theta);

end

fprintf('After the last iteration: J = %f\n', J_history(num_iters));
Part 4: Visualizing J(theta_0, theta_1)
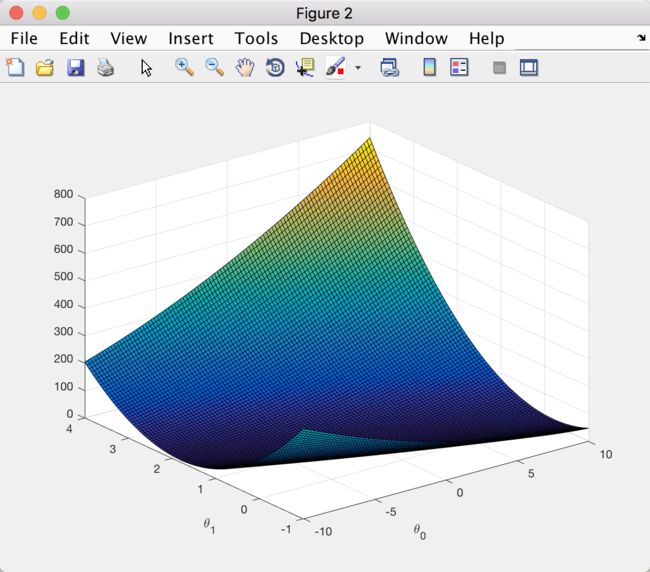
To understand the cost function J(θ) better, you will now plot the cost over a
2-dimensional grid of θ0 and θ1 values.(理解为xy平面是theta,z轴是J)
%% ============= Part 4: Visualizing J(theta_0, theta_1) =============
fprintf('Visualizing J(theta_0, theta_1) ...\n')

% 设置计算 J 的网格
theta0_vals = linspace(-10, 10, 100); % 网格范围:-10到10,分成100份
theta1_vals = linspace(-1, 4, 100); % 根据散点图预测 theta 范围

% 初始化 J_vals 存储矩阵:100*100
J_vals = zeros(length(theta0_vals), length(theta1_vals));

% 求 J_vals,1万个(i, j)点,循环体执行1万次
for i = 1:length(theta0_vals)
    for j = 1:length(theta1_vals)
        t = [theta0_vals(i); theta1_vals(j)]; % 注意 t 是列向量
        J_vals(i,j) = computeCost(X, y, t);
    end
end


J_vals = J_vals'; % surf 在画 meshgrid 是需要先转置z轴的值

% Surface plot 曲面图
figure; % Figure 2
surf(theta0_vals, theta1_vals, J_vals); % surface 画点
xlabel('\theta_0'); % 坐标轴标签,用 \ 可以转义为字母
ylabel('\theta_1');

% Contour plot 等值线图
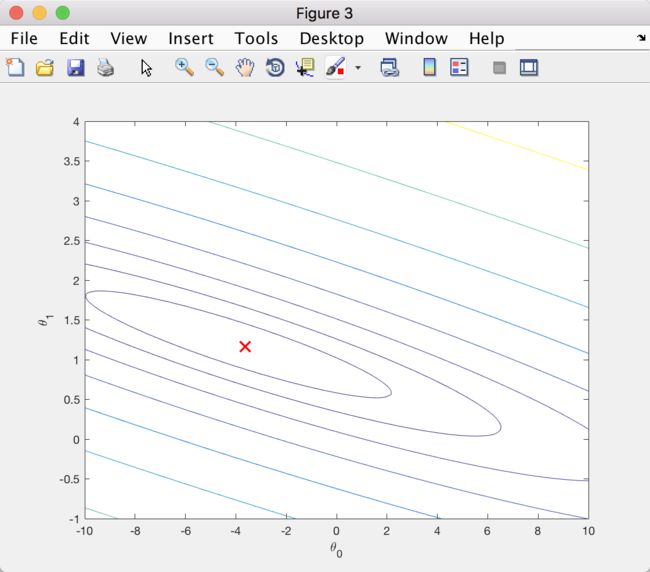
figure; % Figure 3
contour(theta0_vals, theta1_vals, J_vals, logspace(-2, 3, 20)) % 2D 等值线图
% logspace 以 10^x 的形式定义一些列 J 值,x 将[-2, 3]均分为20份
xlabel('\theta_0');
ylabel('\theta_1');

% 在等值线图基础上显示 theta
hold on;
plot(theta(1), theta(2), 'rx', 'MarkerSize', 10, 'LineWidth', 2);
logspace 实例
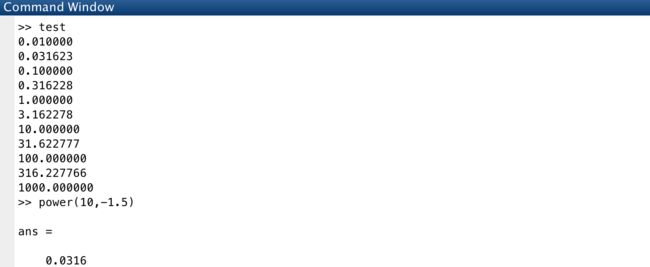
y = logspace(-2, 3, 11);
% [-2, 3] 均分为11份,包括端点
% [-2.0, -1.5, -1.0, -0.5, 0, 0.5, 1.0, 1.5, 2.0, 2.5, 3.0]
% 然后 y = power(10, x)

fprintf('%f\n', y) % 向量输出每个元素
