点运算:灰度映射
描述
由于图像的亮度范围不足或非线性会使图像的对比度不理想。采用图像灰度值变换方法,即改变图像像素的灰度值,以改变图像灰度的动态范围,增强图像的对比度。
效果
实现代码
%灰度映射 (负片) 方式一
clear all;
close all;

img=imread('../images/lena.ppm');
[sx sy] = size(img);
figure; imshow(img); title('original');
vMax = 256;
for i=1:sx
    for j=1:sy
        g(i,j)=255-img(i,j); %计算负片
    end
end
figure; imshow(g); title('result');

%灰度映射 (负片) 方式二
clear all;
close all;

img=imread('../images/lena.ppm');
[sx sy] = size(img);
figure; imshow(img); title('original');
vMax = 256;
img=im2double(img); %将0-255转为0-1
g=1-img;
figure; imshow(g); title('result');

%灰度映射 (负片) 方式三
clear all;
close all;

img=imread('../images/lena.ppm');
[sx sy] = size(img);
figure; imshow(img); title('original');
g=255-img; %计算负片
figure; imshow(g); title('result');
典型灰度映射
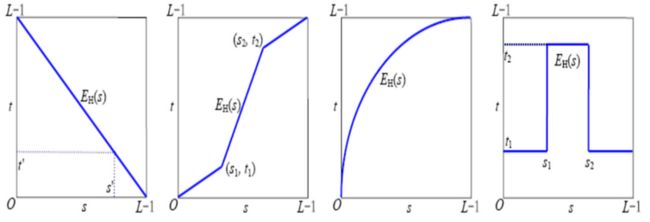
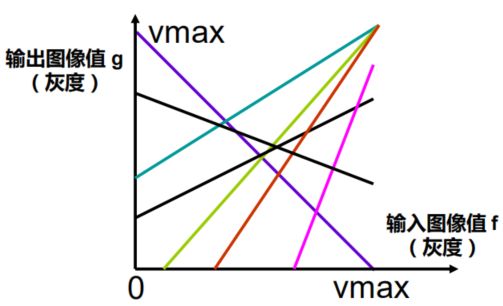
常见的几种灰度变换曲线
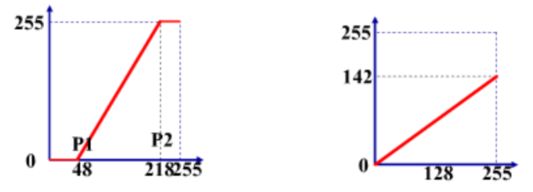
亮度调整
对比度调整
线性变换
公式 g(x,y) = A * f(x,y) + B
例子
%方法一
f=imread('../images/lena.ppm');
figure; imshow(f); title('original');
f=im2double(f);
A=0.5;B=0.1;
g=A*f+B;
figure; imshow(g); title('result');

%方法二
f=imread('../images/lena.ppm');
figure; imshow(f); title('original');
f=im2double(f);
A=0.5;B=0.1;
[sx sy]=size(f); g=zeros(sx,sy);
for i=1:sx
    for j=1:sy
        g(i,j)=A*f(i,j)+B;
    end;
end;
figure; imshow(g); title('result');
效果
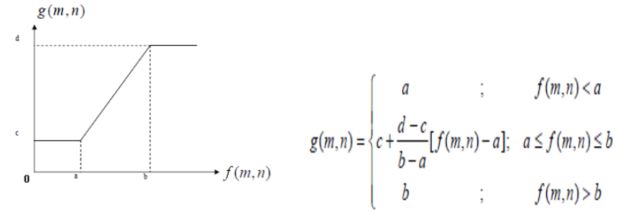
分段线性变换
目的
为了突出感兴趣目标所在的灰度区间,相对抑制那些不感兴趣的灰度空间
原理
进行像素点对点的,灰度级的映射
实例
f=imread('../images/lena.ppm');
figure; imshow(f); title('original');
f=im2double(f);
A1=0.5;B1=0.1;
A2=0.1;B2=0.2;
T=0.5;
[sx sy]=size(f); g=zeros(sx,sy);
for i=1:sx
    for j=1:sy
        if f(i,j)
效果
对数变换
灰度变换函数为对数函数;其实现的效果是扩展地灰度去,压缩搞灰度区:
其中a,b,c是按需要可以调整的参数
代码示例
I=imread('../images/lena.ppm');
subplot(1,2,1);imshow(I);
I=double(I);
I2=42*log(1+I);
I2=uint8(I2);
subplot(1,2,2);imshow(I2);
效果
Y变换
公式:
公式
根据直方图设计映射
红色线使用Log;蓝色线使用Inverse log;绿色线没法简单设计(需要用直方图均衡化)
练习
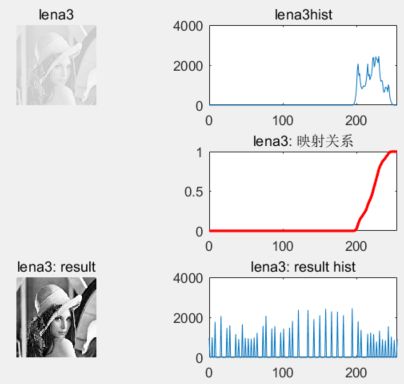
例题1.1:读入lena3.ppm,设计映射关系lut,增强对比度。要求输出3x2的子图到一个figure:
原图       原图直方图
           映射关系
结果图     结果直方图
分析:该图像太亮了,所以应该调整其对比度
答案
clear all;
close all;
fnm = 'lena3';
img=imread('../images/lena3.pbm');
[sx sy]=size(img);
subplot(321);imshow(img);;title(fnm);
h(1:256)=0
for i=1:sy
    for j=1:sx
        k=img(i,j)+1;
        h(k)=h(k)+1;
    end
end
subplot(322);plot(0:255,h);
xlim([0 255]); %设置x轴的上下限
title([fnm, 'hist']);

g=(img - 190)*4;

lut(1:256) = 0;
x = 195:256;
lut(x) = (x-195)*4;

subplot(324);plot(0:255,lut,'r','LineWidth',2);
xlim([0 255]); title([fnm,': 映射关系']);

subplot(325);imshow(g);title([fnm,': result']);

gh = imhist(g);
subplot(326);plot(0:255,gh);
xlim([0 255]);title([fnm,': result hist']);
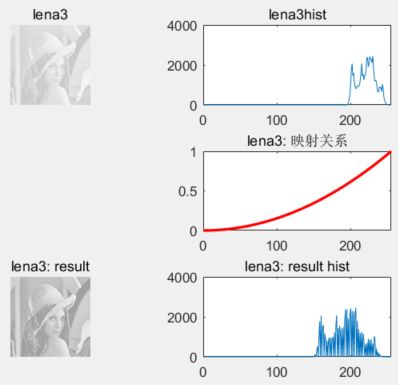
例题1.2:读入lena3.ppm,设计二次幂映射关系lut。要求输出3x2的子图到一个figure:
原图       原图直方图
           映射关系
结果图     结果直方图
代码
clear all;
close all;
fnm = 'lena3';
img=imread('../images/lena3.pbm');
[sx sy]=size(img);
subplot(321);imshow(img);title(fnm);
h(1:256)=0
for i=1:sy
    for j=1:sx
        k=img(i,j)+1;
        h(k)=h(k)+1;
    end
end
subplot(322);plot(0:255,h);
xlim([0 255]);
title([fnm, 'hist']);
img = im2double(img); %将0~255转化为0~1
g=img.*img;

lut(1:256) = 0;
x = 0:255;
x = x/255;
lut = x.*x;

subplot(324);plot(0:255,lut,'r','LineWidth',2);
xlim([0 255]); title([fnm,': 映射关系']);

subplot(325);imshow(g);title([fnm,': result']);

gh = imhist(g);
subplot(326);plot(0:255,gh);
xlim([0 255]);title([fnm,': result hist']);
例2:读入lena3.ppm,直方图均衡化处理。要求输出3x2的子图到一个figure:
原图       原图直方图
           映射关系
结果图     结果直方图
代码
clear all;
close all;
fnm = 'lena3';
img=imread('../images/lena3.pbm');
[sx sy]=size(img);
subplot(321);imshow(img);title(fnm);
h(1:256)=0
for i=1:sy
    for j=1:sx
        k=img(i,j)+1;
        h(k)=h(k)+1;
    end
end
subplot(322);plot(0:255,h);
xlim([0 255]);
title([fnm, 'hist']);
img = im2double(img);
g=histeq(img);

lut(1:256) = 0;
x = 0:255;
x = x/255;

vmax = 256 ; H(1:vmax)=0; H(1)=h(1);
for i=2:vmax
    H(i) = H(i-1) + h(i);
end;
H1 = H/(sx*sy);

lut = H1;

subplot(324);plot(0:255,lut,'r','LineWidth',2);
xlim([0 255]); title([fnm,': 映射关系']);

subplot(325);imshow(g);title([fnm,': result']);

gh = imhist(g);
subplot(326);plot(0:255,gh);
xlim([0 255]);title([fnm,': result hist']);

