更多: 股票数据分析Python+Tushare使用系列(一)(二)(三)等等
本文介绍:Anaconda + jupyterlab 简单使用: 绘制图表
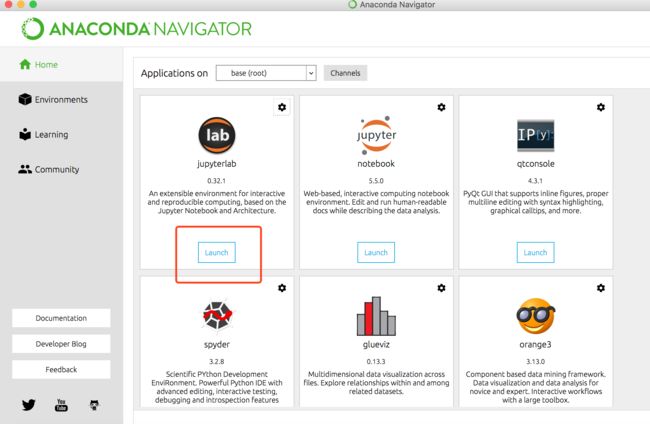
在第一篇中我们介绍了Anaconda的安装,现在打开安装软件:
1: 进入首页的样子:
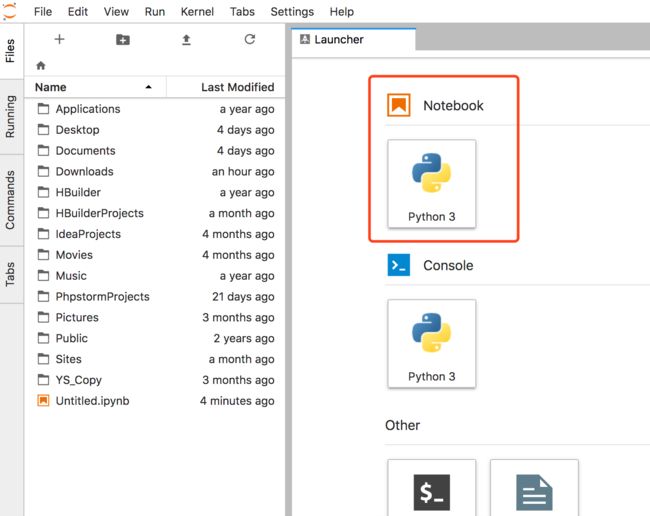
2: 我们选择jupyterlab体验一下, 点击启动(Launch) jupyterlab,自动打开网页:
我们选择第一个:
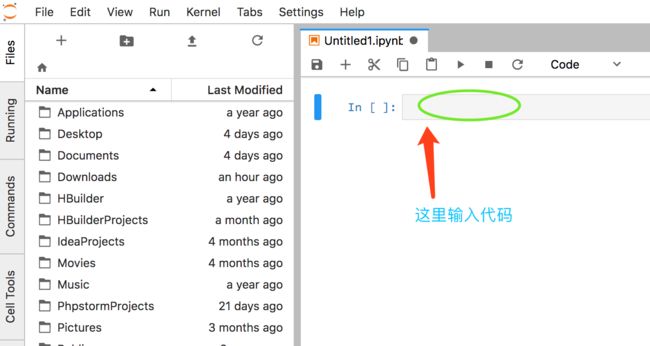
3: 选择后:
4: 偷个懒,网上谁便找一段Python绘制图标代码:
https://blog.csdn.net/xiaodongxiexie/article/details/53123371
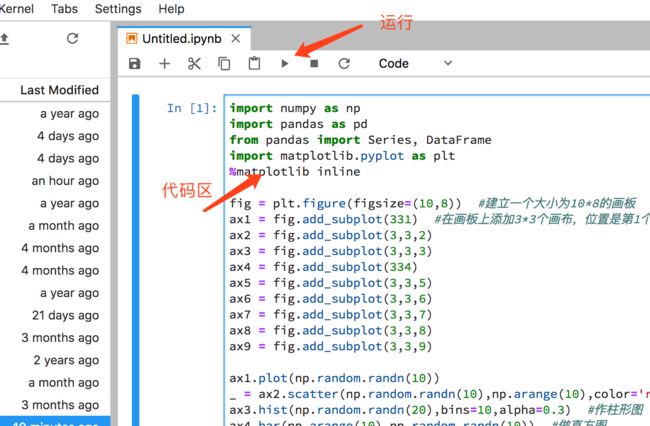
复制第一段代码:
import numpy as np
import pandas as pd
from pandas import Series, DataFrame
import matplotlib.pyplot as plt
%matplotlib inline

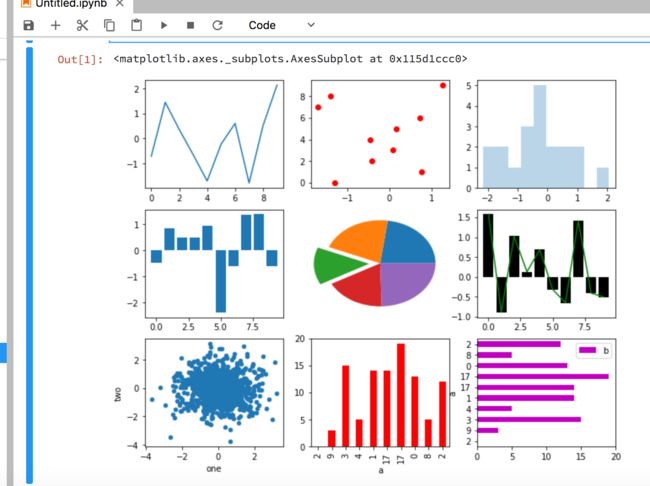
fig = plt.figure(figsize=(10,8))  #建立一个大小为10*8的画板
ax1 = fig.add_subplot(331)  #在画板上添加3*3个画布,位置是第1个
ax2 = fig.add_subplot(3,3,2)
ax3 = fig.add_subplot(3,3,3)
ax4 = fig.add_subplot(334)
ax5 = fig.add_subplot(3,3,5)
ax6 = fig.add_subplot(3,3,6)
ax7 = fig.add_subplot(3,3,7)
ax8 = fig.add_subplot(3,3,8)
ax9 = fig.add_subplot(3,3,9)

ax1.plot(np.random.randn(10))
_ = ax2.scatter(np.random.randn(10),np.arange(10),color='r')  #作散点图
ax3.hist(np.random.randn(20),bins=10,alpha=0.3)  #作柱形图
ax4.bar(np.arange(10),np.random.randn(10))  #做直方图
ax5.pie(np.random.randint(1,15,5),explode=[0,0,0.2,0,0])  #作饼形图

x = np.arange(10)
y = np.random.randn(10)
ax6.plot(x,y,color='green')
ax6.bar(x,y,color='k')

data = DataFrame(np.random.randn(1000,10),
                 columns=['one','two','three','four','five','six','seven','eight','nine','ten'])
data2 = DataFrame(np.random.randint(0,20,(10,2)),columns=['a','b'])
data.plot(x='one',y='two',kind='scatter',ax=ax7)  #针对DataFrame的一些作图
data2.plot(x='a',y='b',kind='bar',ax=ax8,color='red',legend=False)
data2.plot(x='a',y='b',kind='barh',color='m',ax=ax9)
#plt.tight_layout() #避免出现叠影
#plt.show()

