0x00 概述
Volatility是一款开源内存取证框架,能够对导出的内存镜像进行分析,通过获取内核数据结构,使用插件获取内存的详细情况以及系统的运行状态。
特点:
- 开源:Python编写,易于和基于python的主机防御框架集成。
- 支持多平台:Windows,Mac,Linux全支持
- 易于扩展:通过插件来扩展Volatility的分析能力
0x01 安装
安装分为三步走:
- 下载
- 安装必要的python依赖文件
- 安装本体
下载
你可以在Release中找到对应你系统(Mac,Win,Linux)的源代码,当然也可以通过github去获取源码:
git clone https://github.com/volatilityfoundation/volatility.git
依赖
如果只是用Volatility本体的话,这些依赖是没必要装的,但是如果你想用某些插件,还是把以下这些必备的依赖包装上吧。
Distorm3:牛逼的反编译库
pip install distorm3
Yara:恶意软件分类工具
pip install yara
PyCrypto:加密工具集
pip install pycrypto
PIL:图片处理库
pip install pil
OpenPyxl:读写excel文件
pip install openpyxl
ujson:JSON解析
pip install ujson
安装
如果你用的是独立的win、linux、mac执行文件,那就不必安装了。只要用python去执行就好。
若是下载了压缩文件,那你可以选择直接运行python主程序,也可以选择使用python setup.py install的方式将Volatility以一个库的形式安装在系统的特定位置上,从而以后我们可以将Volatility作为一个库在其他脚本中去引用其namespace。
0x02 使用
此处以在Linux上使用为例讲解Volatility的使用方法。
其大体流程如下:

创建用户配置文件
Volatility需要从用户配置文件中读取内核的相关信息,通过这些信息来定位内存中的关键信息并对其进行解析。因此我们需要获取用户配置文件,且这些配置文件需与你要分析的内核版本相匹配,其中包含了内核数据结构以及调试符号。
通常我们可以从github上获取已经整理好的用户配置信息,当然我们也能够自己来编译。以下就是自己编译用户配置文件的过程。
首先我们得装一些工具。
dwarfdump&GCC/Make&KernelHeaders:调试文件导出工具、编译工具以及待分析系统内核头文件
sudo apt-get install dwarfdump build-essential linux-header-'uname -r'
创建vtypes
vtypes是内核数据结构,为创建该数据结构,我们需要检查我们的源码并针对我们要分析的系统内核编译module.c文件,这将会为我们生成一个名为module.dwarf文件,该文件包含了我们所需的内核调试信息。
具体可以这么做:
cd volatility/tools/linux
make
获取符号表
一般我们可以在/boot目录下找到该System.map文件。该文件包含系统的符号信息。
制作用户配置文件
随后对moudle.dwarf以及system.map文件打包成一个zip文件,随后将该zip文件放在volatility/plugins/overlays/linux下。
sudo zip volatility/volatility/plugins/overlays/linux/Ubuntu1404.zip volatility/tools/linux/module.dwarf /boot/System.map-'uname -r'
使用用户配置文件
随后就可以通过以下命令来查看用户配置文件的名字了。
python vol.py --info|grep Linux
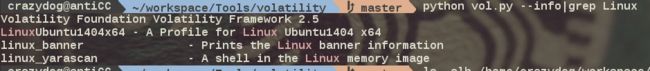
这里面的LinuxUbuntu1404x64就是随后要用的配置文件名了,一般用在选项--profile之后。
获取内存镜像
Volatility并不会抓取内存,因此建议使用lime(Linux Mem Extractor),从intel硬件或虚拟机上抓取内存,当然他也支持安卓系统内存抓取。
下载内存抓取工具Lime
git clone https://github.com/504ensicsLabs/LiME.git
编译工具
cd lime/src
make
加载内核模块
sudo insmod lime-`uname -r`.ko "path=> format= [dio=<0|1>]"
其中 path参数可以为输出文件outfile,用于本地保存或tcp:
我们则是:
sudo insmod lime-`uname -r`.ko "path=/home/crazydog/ubuntu.lime format=lime"
PS:这一步会使得系统非常卡顿,大家使用时请不要使用在生产系统上防止对正常应用造成影响。
使用插件
一般我们这么用我们的Volatility:
python vol.py -f /home/crazydog/ubuntu.lime --profile=LinuxUbuntu1404x64 linux_ifconfig
一般我们可以使用的插件如下。
# 查看那些针对Linux设计的插件
# python vol.py --info 插件那一节中不带前缀的是windows的插件,带linux前缀的是linux的插件,带mac前缀的……
python vol.py --info | grep -i linux_
linux_apihooks             - Checks for userland apihooks
linux_arp                  - Print the ARP table
linux_banner               - Prints the Linux banner information
linux_bash                 - Recover bash history from bash process memory
linux_bash_env             - Recover a process' dynamic environment variables
linux_bash_hash            - Recover bash hash table from bash process memory
linux_check_afinfo         - Verifies the operation function pointers of network protocols
linux_check_creds          - Checks if any processes are sharing credential structures
linux_check_evt_arm        - Checks the Exception Vector Table to look for syscall table hooking
linux_check_fop            - Check file operation structures for rootkit modifications
linux_check_idt            - Checks if the IDT has been altered
linux_check_inline_kernel  - Check for inline kernel hooks
linux_check_modules        - Compares module list to sysfs info, if available
linux_check_syscall        - Checks if the system call table has been altered
linux_check_syscall_arm    - Checks if the system call table has been altered
linux_check_tty            - Checks tty devices for hooks
linux_cpuinfo              - Prints info about each active processor
linux_dentry_cache         - Gather files from the dentry cache
linux_dmesg                - Gather dmesg buffer
linux_dump_map             - Writes selected memory mappings to disk
linux_dynamic_env          - Recover a process' dynamic environment variables
linux_elfs                 - Find ELF binaries in process mappings
linux_enumerate_files      - Lists files referenced by the filesystem cache
linux_find_file            - Lists and recovers files from memory
linux_getcwd               - Lists current working directory of each process
linux_hidden_modules       - Carves memory to find hidden kernel modules
linux_ifconfig             - Gathers active interfaces
linux_info_regs            - It's like 'info registers' in GDB. It prints out all the
linux_iomem                - Provides output similar to /proc/iomem
linux_kernel_opened_files  - Lists files that are opened from within the kernel
linux_keyboard_notifiers   - Parses the keyboard notifier call chain
linux_ldrmodules           - Compares the output of proc maps with the list of libraries from libdl
linux_library_list         - Lists libraries loaded into a process
linux_librarydump          - Dumps shared libraries in process memory to disk
linux_list_raw             - List applications with promiscuous sockets
linux_lsmod                - Gather loaded kernel modules
linux_lsof                 - Lists file descriptors and their path
linux_malfind              - Looks for suspicious process mappings
linux_memmap               - Dumps the memory map for linux tasks
linux_moddump              - Extract loaded kernel modules
linux_mount                - Gather mounted fs/devices
linux_mount_cache          - Gather mounted fs/devices from kmem_cache
linux_netfilter            - Lists Netfilter hooks
linux_netscan              - Carves for network connection structures
linux_netstat              - Lists open sockets
linux_pidhashtable         - Enumerates processes through the PID hash table
linux_pkt_queues           - Writes per-process packet queues out to disk
linux_plthook              - Scan ELF binaries' PLT for hooks to non-NEEDED images
linux_proc_maps            - Gathers process memory maps
linux_proc_maps_rb         - Gathers process maps for linux through the mappings red-black tree
linux_procdump             - Dumps a process's executable image to disk
linux_process_hollow       - Checks for signs of process hollowing
linux_psaux                - Gathers processes along with full command line and start time
linux_psenv                - Gathers processes along with their static environment variables
linux_pslist               - Gather active tasks by walking the task_struct->task list
linux_pslist_cache         - Gather tasks from the kmem_cache
linux_pstree               - Shows the parent/child relationship between processes
linux_psxview              - Find hidden processes with various process listings
linux_recover_filesystem   - Recovers the entire cached file system from memory
linux_route_cache          - Recovers the routing cache from memory
linux_sk_buff_cache        - Recovers packets from the sk_buff kmem_cache
linux_slabinfo             - Mimics /proc/slabinfo on a running machine
linux_strings              - Match physical offsets to virtual addresses (may take a while, VERY verbose)
linux_threads              - Prints threads of processes
linux_tmpfs                - Recovers tmpfs filesystems from memory
linux_truecrypt_passphrase - Recovers cached Truecrypt passphrases
linux_vma_cache            - Gather VMAs from the vm_area_struct cache
linux_volshell             - Shell in the memory image
linux_yarascan             - A shell in the Linux memory image
linux_arp
ARP表
linux_banner
系统信息

linux_check_inline_kernel
内核内联hook

linux_check_evt_arm
在ARM处理器上,以Exception Vector Table来查看系统调用表的钩子
linux_check_tty
检查伪终端

linux_hidden_modules
检查隐藏的模块,可用在某些内核经rootkit扫描
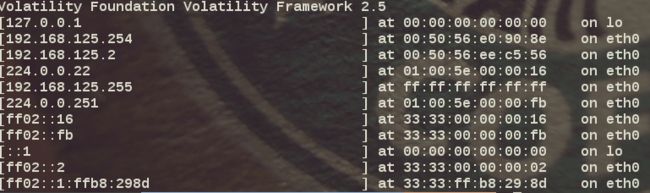
linux_ifconfig
检查打开的网卡信息。

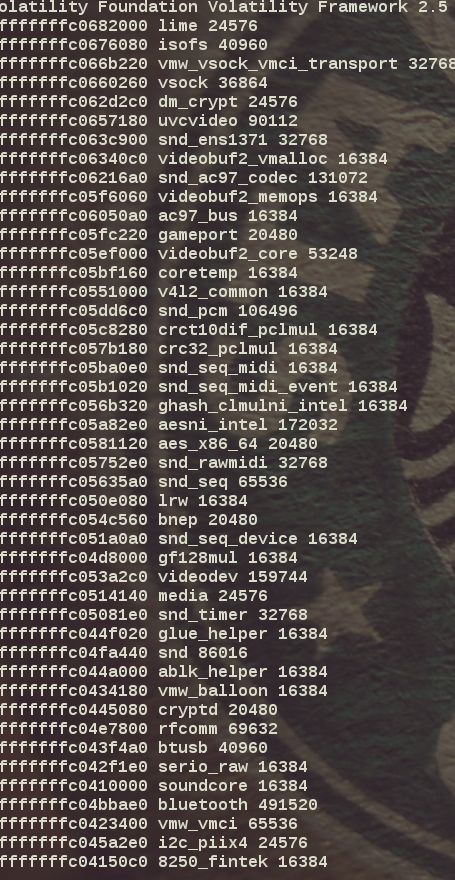
linux_lsmod
列出内核模块。这里我希望列出我加载进去的lime.ko 这是假设你的lsmod已经被人hook了,这个时候可以使用它来进行取证。
全部的模块如下:
linux_netstat
查看其中的TCP端口

总之功能强大。
输出
对于不同的插件,Volatility取证得出的结果可以以不同的方式输出。输出方式包含:
- text 以表的形式文本输出
- dot 以点阵图形式输出
- html
- json 可用于不同的api之间数据交换
- sqlite 存到数据库中
- quick 以|符号分隔地输出文本
- xlsx 以excel文件输出
一般我们可以-h命令来获取不同插件的输出格式。如
python vol.py linux_pstree -h
Module Output Options: dot, greptext, html, json, sqlite, text, xlsx

---------------------------------
Module PSTree
---------------------------------
Print process list as a tree
以html输出
python vol.py --profile=LinuxUbuntu1404_Manualx64 linux_pstree -f /home/crazydog/workspace/miscellaneous/Ubuntu1404.lime --output=html --output-file=pstree1.html
结果如下:

以json文件输出
python vol.py --profile=LinuxUbuntu1404_Manualx64 linux_pstree -f /home/crazydog/workspace/miscellaneous/Ubuntu1404.lime --output=json --output-file=pstree1.json
结果如下:

以sqlite输出
python vol.py --profile=LinuxUbuntu1404_Manualx64 linux_pstree -f /home/crazydog/workspace/miscellaneous/Ubuntu1404.lime --output=sqlite --output-file=pstree.db
sqlite3 pstree.db
SQLite version 3.8.2 2013-12-06 14:53:30
Enter ".help" for instructions
Enter SQL statements terminated with a ";"
sqlite> .schema
CREATE TABLE linux_pstree( id INTEGER, "Offset" TEXT, "Name" TEXT, "Level" TEXT, "Pid" TEXT, "Ppid" TEXT, "Uid" TEXT, "Gid" TEXT, "Euid" TEXT);
sqlite> select * from linux_pstree limit 5;
1|18446612137572106240|init|init|1|0|0|0|18446612137528196244
2|18446612135375493200|ureadahead|.ureadahead|337|1|0|0|18446612133204786132
3|18446612133205114880|upstart-udev-br|.upstart-udev-br|465|1|0|0|18446612135375781588
4|18446612133213175808|systemd-udevd|.systemd-udevd|471|1|0|0|18446612137544357140
5|18446612133194321536|upstart-file-br|.upstart-file-br|523|1|0|0|18446612133204784596
sqlite>
自研插件的格式化输出功能
我们自己写的插件里面通过定义我们要显示的数据以及其类型来定义数据的输出。
我们可以按照以下模板来重写默认的渲染器以及主次一个新的渲染器。
以下转自volatility的wiki
import volatility.plugins.common as common
import volatility.utils as utils

from volatility.renderers import TreeGrid
from volatility.renderers.basic import Address, Hex

class MyPlugin(common.AbstractWindowsCommand):
    """My test plugin"""

    def calculate(self):
        """Body of the plugin goes here"""

        addr_space = utils.load_as(self._config)

        ## gather some data from the memory dump using the address space
        ## then yield each result to the generator/render functions

        data = [
            [0xFFFFFFFF80004210, "testing123", 400, 6500],
            [0xFFFFFFFF80008726, "testing345", 800, 124400],
            ]

        for result in data:
            yield result

    def render_dot(self, outfd, data):
        """Here we can override the default dot renderer"""

        ...

    def render_test(self, outfd, data):
        """Here we register a new handler invoked with --output=test"""

        ...

    def unified_output(self, data):
        """This standardizes the output formatting"""

        ## make sure the number of columns (4) and their data types match
        ## what calculate() and generator() yields

        return TreeGrid([("Offset", Address),
                        ("Name", str),
                        ("ID", int),
                        ("Count", Hex),
                        self.generator(data))

    def generator(self, data):
        """This yields data according to the unified output format"""

        ## the variables "unpacked" here must match what calculate() yields
        for offset, name, id, count in data:

            ## make sure to wrap each variable according to its data type
            yield (0, [Address(offset), str(name), int(id), Hex(count)])
0x03 小Bug
在使用的过程中发现volatility存在一个小bug,linux_pstree在输出的时候会遇到一些问题,具体问题以及山寨的解决方案如github issue所见。
0x04 优缺点
优点
- 能够直接获取内存对内存离线取证
- 可针对多个平台进行分析
- 程序跨平台
- 能够应对应用层的攻击,如rootkit扫描,端口扫描等
缺点
- 需要编译和安装的依赖较多
- 虽然可以自主制作用户配置文件,但是抓取内存需要在受害主机上安装内存抓取模块,该模块需要LKM支持以及需要GCC编译,拥有linux内核的头文件,要求苛刻,取证可能会因主机的实际情况出现阻碍。