Pyhon 2.7
IDE Pycharm 5.0.3
numpy 1.11.0
目前接口库
@MrLevo520–数据转化接口
仍在不断更新
目的
将混淆矩阵可视化展现出来
准备工作
请先安装numpy,matplotlib
接口代码
新建一个confusion_matrix_png.py文件,输入如下代码
# -*- coding: utf-8 -*-
import numpy as np
import matplotlib.pyplot as plt
from pylab import *

# 其中cm是计算好的混淆矩阵
# cm = confusion_matrix(test_label, predict_label)
# 比如上述这样产生cm
def ConfusionMatrixPng(cm,classlist):

    norm_conf = []
    for i in cm:
        a = 0
        tmp_arr = []
        a = sum(i, 0)
        for j in i:
            tmp_arr.append(float(j) / float(a))
        norm_conf.append(tmp_arr)
    fig = plt.figure()
    plt.clf()
    ax = fig.add_subplot(111)
    ax.set_aspect(1)
    res = ax.imshow(np.array(norm_conf), cmap=plt.cm.jet,
                    interpolation='nearest')
    width = len(cm)
    height = len(cm[0])
    cb = fig.colorbar(res)
    alphabet = classlist
    plt.xticks(fontsize=7)
    plt.yticks(fontsize=7)
    locs, labels = plt.xticks(range(width), alphabet[:width])
    for t in labels:
        t.set_rotation(90)
    # plt.xticks('orientation', 'vertical')
    # locs, labels = xticks([1,2,3,4], ['Frogs', 'Hogs', 'Bogs', 'Slogs'])
    # setp(alphabet, 'rotation', 'vertical')
    plt.yticks(range(height), alphabet[:height])
    plt.savefig('confusion_matrix.png', format='png')
    plt.show()
接口说明
ConfusionMatrixPng(cm,classlist)
# cm 是混淆矩阵,由confusion_matrix(test_label, predict_label)产生
# classlist是需要混淆矩阵中的各类别,也就是横/纵坐标组成的列表
接口(函数)调用实例
在同一工程目录下的另一个py文件中只需要操作如下
import confusion_matrix_png as cmp
cm = xxx(找不到数据了额。。)
classlist =  ['4', '5', '6', '11', '15', '16', '17', '20', '22', '24', '28', '30', '32', '33','34', '35', '36', '37', '38', '40', '41', '45', '49', '50', '63', '72']

cmp.ConfusionMatrixPng(cm,classlist)
执行效果
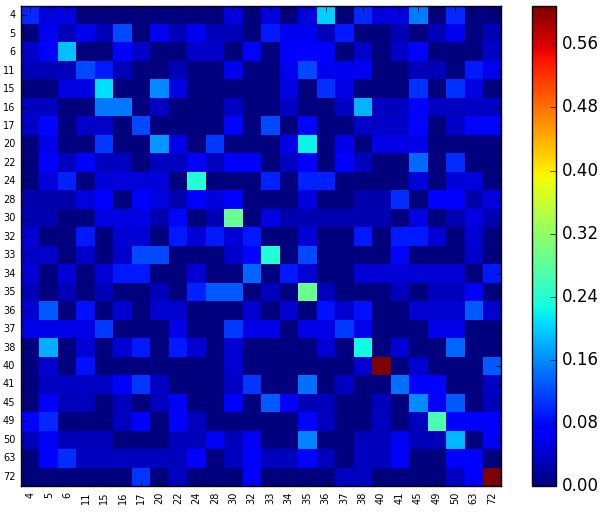
混淆矩阵可视化
(我现在处理的样本精度很低,所以展示效果不是很好)
最后
调用接口的好处就是在一个大的项目中,分割开来处理,每个人写规范的接口文件,之后想用哪个模块直接用就可以了,当然,文档和接口规范得自己注意!
致谢
提供代码的博客我找不到了,很抱歉,我是在他的基础上封装了一下函数而已,自己没有很多工作量,所以很抱歉。