唯一值和分级渲染JSON定义
1.环境说明
ArcGIS 10.4.1
JS API 3.15
2.以JSON参数构建唯一值和分级渲染
使用JSON的好处,在前面文章中已经说明。专题渲染方法对应的JSON格式可在REST API中查看,也可以先按常规方法定义后,在调用toJson()方法输出。
(1)唯一值渲染的JSON格式定义
唯一值渲染需要结合点、线和面符号一起使用,JSON定义格式如下:
{
"type": "uniqueValue",
"field1": "渲染字段名",
"defaultSymbol": {
"color": [0, 0, 0, 64],
"outline": {
"color": [0, 0, 0, 255],
"width": 1,
"type": "esriSLS",
"style":"esriSFSNull"
},
"type": "esriSFS",
"style":"esriSFSNull"
},
"uniqueValueInfos": [{
"value": "唯一值1",
"symbol": {
"color": [255, 0, 0, 128],
"outline": {
"color": [0, 0, 0, 255],
"width": 1,
"type": "esriSLS",
"style":"esriSLSSolid"
},
"type": "esriSFS",
"style":"esriSFSSolid"
}
}, {
"value": "唯一值2",
"symbol": {
"color": [0, 255, 0, 128],
"outline": {
"color": [0, 0, 0, 255],
"width": 1,
"type":"esriSLS",
"style":"esriSLSSolid"
},
"type": "esriSFS",
"style":"esriSFSSolid"
}
},
……]
}
(2)分级渲染的JSON格式定义
分级渲染需要结合点、线和面符号一起使用,JSON定义格式如下:
{
"type":"classBreaks",
"field":"渲染字段名",
"defaultSymbol":{
"color":[150,150,150,128],
"outline":{
"color":[0,0,0,255],
"width":1,
"type":"esriSLS",
"style":"esriSLSSolid"
},
"type":"esriSFS",
"style":"esriSFSSolid"
},
"minValue":最小值,
"classBreakInfos":[{
"symbol":{
"color":[56,168,0,128],
"outline":{
"color":[0,0,0,255],
"width":1,
"type":"esriSLS",
"style":"esriSLSSolid"
},
"type":"esriSFS",
"style":"esriSFSSolid"
},
"classMaxValue":区间值1
},
{
"symbol":{
"color":[139,209,0,128],
"outline":{
"color":[0,0,0,255],
"width":1,
"type":"esriSLS",
"style":"esriSLSSolid"
},
"type":"esriSFS",
"style":"esriSFSSolid"
},
"classMaxValue":区间值2
},
……]
}
3.唯一值渲染和分级渲染测试
(1)构建唯一值渲染JSON数据
//创建唯一值JSON,面填充符号function createUniqueRendererJson(uniqueFieldName,uniqueValues,uniqueColors){
var rendererJson= {
"type":"uniqueValue",
"field1": uniqueFieldName,
"defaultSymbol": {
"color": uniqueColors[0],
"type":"esriSFS",
"style":"esriSFSSolid"},
"uniqueValueInfos": []
};
var i=0;
for(i;i < uniqueValues.length;i++){
var idx=1+i;
var obj= {
"value": uniqueValues[i],
"symbol": {
"color": uniqueColors[idx],
"type":"esriSFS",
"style":"esriSFSSolid"}
};
rendererJson.uniqueValueInfos.push(obj);
}
return rendererJson;
}
(2)构建分级渲染JSON数据
//创建分级渲染JSON,点符号function createClassbreakRendererJson(classbreakFieldName,classbreakValues,classbreakColors){
var rendererJson= {
"type":"classBreaks",
"field": classbreakFieldName,
"defaultSymbol": {
"color": classbreakColors[0],
"size":12,
"type":"esriSMS",
"style":"esriSMSCircle"},
"minValue": classbreakValues[0],
"classBreakInfos": []
};
vari=1;
for(i;i < classbreakValues.length;i++){
var obj= {
"classMaxValue": classbreakValues[i],
"symbol": {
"color": classbreakColors[i],
"size":12,
"type":"esriSMS",
"style":"esriSMSCircle"}
};
rendererJson.classBreakInfos.push(obj);
}
return rendererJson;
}
(3)设置FeatureLayer的渲染
var statesUrl="https://sampleserver6.arcgisonline.com/arcgis/rest/services/USA/MapServer/2";
var states=new FeatureLayer(statesUrl,{
outFields:["*"]
});
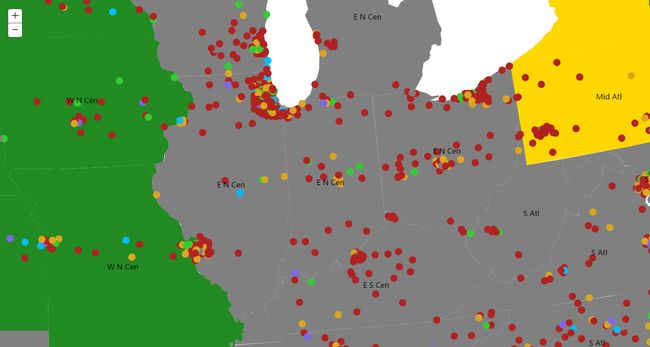
var uniqueJson=createUniqueRendererJson("sub_region",["Pacific","Mtn","W N Cen","Mid Atl"],[[128,128,128],[165,42,42],[30,144,255],[34,139,34],[255,215,0]]);
var uniqueRenderer=new UniqueValueRenderer(uniqueJson);
states.setRenderer(uniqueRenderer);
map.addLayer(states);
var citiesUrl="https://sampleserver6.arcgisonline.com/arcgis/rest/services/USA/MapServer/0";
var citiesLayer=new FeatureLayer(citiesUrl,{
outFields: ["*"]
});
var classbreaksRenderer=new ClassBreaksRenderer(createClassbreakRendererJson("pop2000",[10000,30000,50000,80000,100000,200000],[[128,128,128],[178,34,34],[218,165,32],[50,205,50],[0,191,255],[123,104,238]]));
citiesLayer.setRenderer(classbreaksRenderer);
map.addLayer(citiesLayer);
效果:
4.源码
唯一值和分级渲染JSON定义
