Identify the highest revenue generating products
Find opportunities to upsell additional items
Compare the effectiveness of various marketing channels
【报告一:电子商务概述 】
Conversions > Ecommerce > Overview
Ecommerce Conversion Rate 电子商务转化率
导致购买的会话百分比(网站访问)
the percentage of Sessions (site visits) that result in purchases.
Transactions 交易
通过网站进行的采购总数
total number of purchases made through the site
Revenue 收入
total amount spent
客户花费的总金额
平均订单价值 Average order value
每笔订单的平均收入金额
average amount of revenue earned for each order
独特购买 Unique purchases
包含单个/一组产品的交易次数
number of times any individual product (or group of products) was included in a transaction
它将每个结账中包含的【商品类型】作为单独购买进行计数
例如,如果客户购买了12个苹果,6个香蕉和4个梨,Google Analytics会将其计为3个独特购买和1个交易。
例如有4,549个独特采购和2,334个交易,平均达到4,549 / 2,334 = 1.95; 或者每笔交易约有两次独特的产品购买。
people are only buying two products at once in an average purchase——>upselling additional relevant products when they are about to check out
【报告二:Performance by Product】
Conversions > Ecommerce > Product Performance
Popular low cost products represent upselling opportunities
【报告三:Channels Driving Revenue】
Look at how purchasers found your site
Acquisition > All Traffic > Channels
Explorer > E-commerce
比较各种渠道的销售贡献:社交媒体,自然搜索,付费搜索,展示广告和电子邮件营销。
看看哪些渠道贡献了最多的收入,哪些渠道的电子商务转化率最高,哪些渠道订单价值最高。
【报告四:the Multi-Channel Funnel reports】
Conversions > Multi-Channel Funnels > Assisted Conversions
Assisted Conversions
Assisted Conversions Value
报告三中只能看到用户完成了最终购买行为的渠道,而多渠道可以看到的是哪些渠道为最终购买提供了助力。
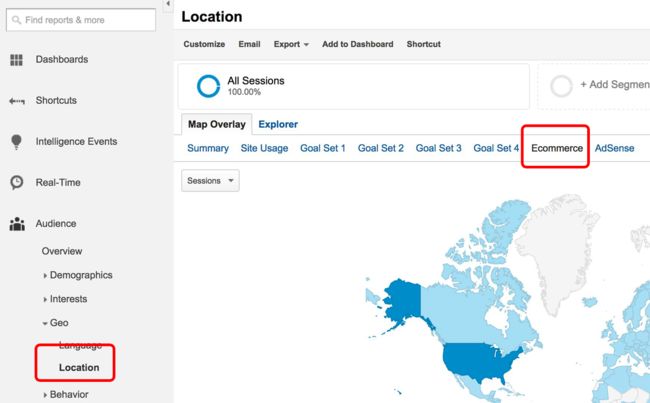
【报告五:Revenue by Geography】 地理收入分布
Audience > Geo > Location
Examine your bounce rate from different perspectives.
The Audience Overview report provides the overall bounce rate for your site.
The Channels report provides the bounce rate for each channel grouping.
The All Traffic report provides the bounce rate for each source/medium pair.
The All Pages report provides the bounce rate for individual pages.


