相较于我国的证券市场,数字货币对于程序化交易的接受程度非常好,这可能出于两种原因:
1、交易所希望通过频繁的交易为其带来手续费收入
2、数字货币本身就是geek的产物
gekko是一个开源技术框架,可以进行基本的程序化交易。也许是由于数字货币市场中大量的用户使用程序化交易的原因,如果直接使用现成的指标作为买入、卖出依据,你会得到相当差的结果。
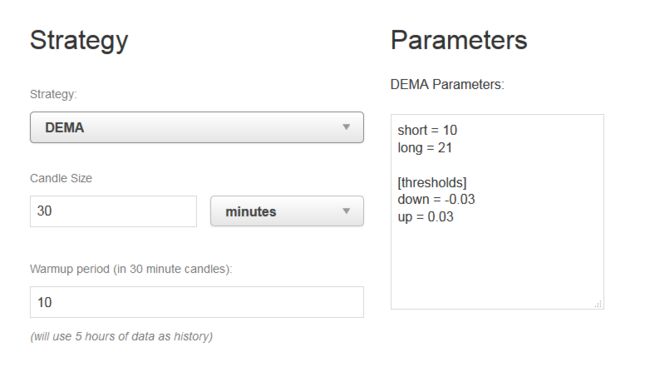
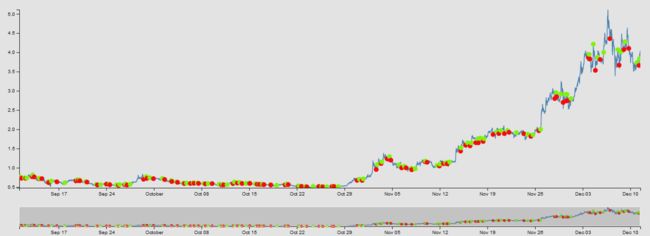
我使用DEMA默认指标对2017年9月-12月的EOS数据进行backtest,在市场上涨418%的同时交易却亏损42%,如下:
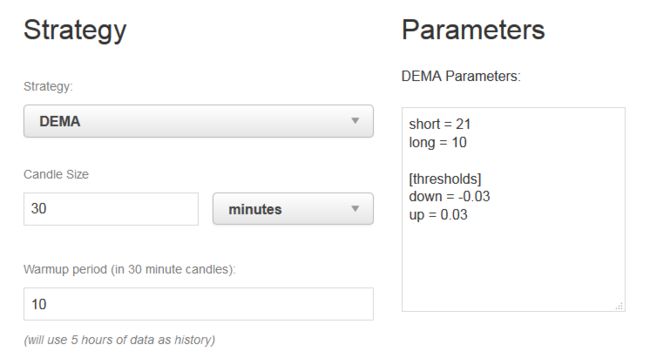
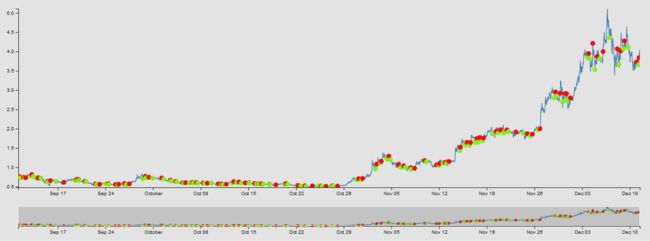
但是我们完全反向思维的将short与long对调,即short设置为大数21,long设置为小数10,确得到了盈利178%的结果。
这样的测试如若大家有兴趣可以自己跑,我跑了几种主流coin均出现了同样的情况。我认为这是别人的策略故意”骗炮“的结果。综上,只有自己书写的策略才能够达到实际盈利的效果。
gekko的策略库是使用js书写的,开源框架已经提供给了一些简单的策略,提供的策略放置在${gekko_PATH}/strategies文件夹中。简单介绍请参考官方文档站:
https://gekko.wizb.it/docs/strategies/creating_a_strategy.html
下面我们说一下官方文档中介绍较少的内容。
指数
在交易中存在众多指数,如MACD、CCI、RSI等,gekko开源库中提供了一些指标的实现,我们以DEMA举例。
exponential moving average (EMA)——指数平均数指标。它是一种趋向类指标,指数平均数指标是以指数式递减加权的移动平均。理解了EMA的含义后,就可以理解其用途了,简单的说,当要比较数值与均价的关系时,用MA就可以了,而要比较均价的趋势快慢时,用EMA更稳定;有时,在均价值不重要时,也用EMA来平滑和美观曲线。
EMA算法实现(strategies\indicators\EMA.js)如下:
var Indicator = function(weight) {
  this.input = 'price';
  this.weight = weight;
  this.result = false;
  this.age = 0;
}

Indicator.prototype.update = function(price) {
  // 第一次进入,无法计算EMA值,因为没有yesterday
  if(this.result === false)
    this.result = price;

  this.age++;
  this.calculate(price);

  return this.result;
}

//  同上方公式,
//    calculation (based on tick/day):
//  EMA = Price(t) * k + EMA(y) * (1 – k)
//  t = today, y = yesterday, N = number of days in EMA, k = 2 / (N+1)
Indicator.prototype.calculate = function(price) {
  // weight factor
  var k = 2 / (this.weight + 1);

  // yesterday
  var y = this.result;

  // calculation
  this.result = price * k + y * (1 - k);
}

module.exports = Indicator;
以上我们实现了EMA指标的基本运算,gekko还给出了使用GoxTradingBot思想实现的DEMA算法。该算法使用快线(short)与慢线(long)的差与两者中位数的比作为指标,当指标超过上限时触发卖出指令,当指标低于下限时触发买入指令。本文章不讨论该算法的可行性,有兴趣可移步github,或者bitcointlalk。
DEMA实现(strategies\indicators\DEMA.js)如下
// 引用上面的EMA代码
var EMA = require('./EMA.js');

var Indicator = function(config) {
  this.input = 'price'
  this.result = false;
  this.short = new EMA(config.short);
  this.long = new EMA(config.long);
}

// 分别向快线与慢线中灌入当前价格,计算当前EMA
Indicator.prototype.update = function(price) {
  this.short.update(price);
  this.long.update(price);
  this.calculateEMAdiff();
}

// 该方法来自GoxTradingBot
// https://github.com/virtimus/GoxTradingBot/blob/85a67d27b856949cf27440ae77a56d4a83e0bfbe/background.js#L145
Indicator.prototype.calculateEMAdiff = function() {
  var shortEMA = this.short.result;
  var longEMA = this.long.result;

  this.result = 100 * (shortEMA - longEMA) / ((shortEMA + longEMA) / 2);
}

module.exports = Indicator;
最终实现DEMA算法实现(strategies\DEMA.js)如下:
// helpers
var _ = require('lodash');
var log = require('../core/log.js');

// 新模块
var method = {};

// 初始化
method.init = function() {
  // 策略名称
  this.name = 'DEMA';

  this.currentTrend;
  this.requiredHistory = this.tradingAdvisor.historySize;

  // 引用DEMA指标
  this.addIndicator('dema', 'DEMA', this.settings);
}

// 在新的蜡烛(迭代)出现时做什么?
method.update = function(candle) {
  // 啥也不做,这是模板,需要时可以加
}

// 向日志中打印每次迭代的内容
method.log = function() {
  var dema = this.indicators.dema;

  log.debug('calculated DEMA properties for candle:');
  log.debug('\t', 'long ema:', dema.long.result.toFixed(8));
  log.debug('\t', 'short ema:', dema.short.result.toFixed(8));
  log.debug('\t diff:', dema.result.toFixed(5));
  log.debug('\t DEMA age:', dema.short.age, 'candles');
}

method.check = function(candle) {
  // DEMA策略
  var dema = this.indicators.dema;
  // 当次迭代的结果,见上一个程序块中的说明。
  var diff = dema.result;
  // 这个周期的收盘价
  var price = candle.close;

  var message = '@ ' + price.toFixed(8) + ' (' + diff.toFixed(5) + ')';
  // 超过上限,触发卖出信号
  if(diff > this.settings.thresholds.up) {
    log.debug('we are currently in uptrend', message);
    // 如果触发时有仓位,则卖出
    if(this.currentTrend !== 'up') {
      this.currentTrend = 'up';
      this.advice('long');
    } else //否则啥也不做
      this.advice();
  }
  // 低于下限,触发买入信号
  else if(diff < this.settings.thresholds.down) {
    log.debug('we are currently in a downtrend', message);
    // 如果触发时没有仓位,则买入
    if(this.currentTrend !== 'down') {
      this.currentTrend = 'down';
      this.advice('short');
    } else //否则啥也不做
      this.advice();
  }
  // 在上限与下限之间,啥也不做
  else {
    log.debug('we are currently not in an up or down trend', message);
    this.advice();
  }
}

module.exports = method;
附:常用的candle指标如下:
- candle.close: the closing price of the candle
- candle.high: the highest price of the candle
- candle.low: the lowest price of the candle
- candle.volume: the trading volume of that candle
- candle.trades: number of trades in that candle
参考文献:
Gekko策略基础
Gekko官网
EMV维基百科


