照猫画虎完成上证50结构可视化
猫在这里 Visualizing the stock market structure
画虎的大致步骤
- 第一步,使用tushare获取上证50股票列表
- 第二步,使用tushare获取每只股票的历史交易数据
- 第三步,对数据进行处理,使用sklearn的相关模型进行嵌套,根据算法获得分类化的输出
- 第四步,使用sklearn,做一次局部线性嵌入,数据降为二维
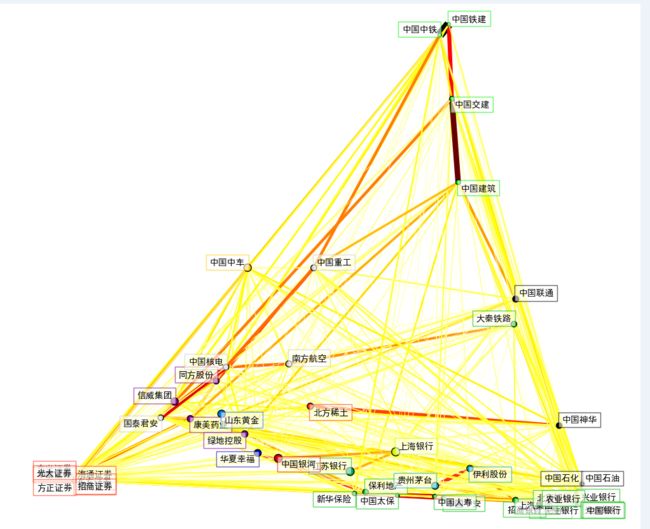
- 第五步,使用matplotlib,二维数据可视化
既然说了是照猫画虎,原理什么的自然是无力解释,相关概念还是靠搜索引擎吧。
完整代码
from datetime import datetime
import tushare as ts
import pandas as pd
import numpy as np
import matplotlib.pyplot as plt
from matplotlib.collections import LineCollection
from sklearn import cluster, covariance, manifold

# 第一步
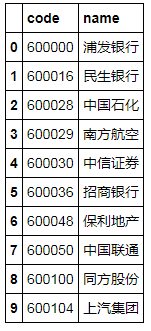
pool = ts.get_sz50s()
names = pool.name
pool.head(10)
# 第二步
d1 = '2014-01-01'
d2 = '2017-09-30'
variation = pd.DataFrame()
for code in pool.code:
    k = ts.get_k_data(code, d1, d2).set_index('date')
    var = k['close'] - k['open']
    var.name = code
    variation = pd.concat([variation, var], axis=1)
可能是网速原因,有时候拿数据很慢,为了便于数据的重复利用,可以把得到的结果暂时保存起来
variation.fillna(method='ffill', inplace=True)
# variation.fillna(0,inplace=True)
variation.to_csv('sz50.csv')
不同的缺省值处理会造成不同的分类结果,但是差异不大。如果把缺省部分全部处理成0,调试的时候会遇到 ‘the system is too ill-conditioned for this solver’。难道是数据量不够?
anyway,该死的停牌。
# 第三步
variation = pd.read_csv('sz50.csv', index_col=0)
# 缺省值处理
variation.fillna(0,inplace=True)

edge_model = covariance.GraphLassoCV()
X = variation.copy()
X /= X.std(axis=0)
edge_model.fit(X)

_, labels = cluster.affinity_propagation(edge_model.covariance_)
n_labels = labels.max()

print labels

for i in range(n_labels + 1):
    print('Cluster %i: %s' % ((i + 1), ', '.join(names[labels == i])))
[ 6  6  0 12 10  6  6  0  1  6 10  2  1  1  4  3  1 10  4  5 10 10  6  0  6
  6  7 10 12  8  6  6  6  6  7  6  6  6  7 10  9 10  7  6  0 11 10 12  6 12]
Cluster 1: 中国石化, 中国联通, 中国神华, 中国石油
Cluster 2: 同方股份, 信威集团, 康美药业, 绿地控股
Cluster 3: 华夏幸福
Cluster 4: 山东黄金
Cluster 5: 贵州茅台, 伊利股份
Cluster 6: 江苏银行
Cluster 7: 浦发银行, 民生银行, 招商银行, 保利地产, 上汽集团, 大秦铁路, 兴业银行, 北京银行, 农业银行, 中国平安, 交通银行, 新华保险, 工商银行, 中国太保, 中国人寿, 光大银行, 中国银行
Cluster 8: 中国铁建, 中国中铁, 中国建筑, 中国交建
Cluster 9: 上海银行
Cluster 10: 中国中车
Cluster 11: 中信证券, 北方稀土, 海通证券, 东方证券, 招商证券, 东兴证券, 华泰证券, 光大证券, 方正证券
Cluster 12: 中国银河
Cluster 13: 南方航空, 国泰君安, 中国核电, 中国重工
# 第四步
node_position_model = manifold.LocallyLinearEmbedding(
    n_components=2, eigen_solver='dense', n_neighbors=6)

embedding = node_position_model.fit_transform(X.T).T
# 第五步
font = {'family': 'SimHei',
          'color': 'black',
          'weight': 'normal',
          'size': 18,
          }

plt.figure(1, facecolor='w', figsize=(10, 8))
plt.clf()
ax = plt.axes([0., 0., 1., 1.])
plt.axis('off')

partial_correlations = edge_model.precision_.copy()
d = 1 / np.sqrt(np.diag(partial_correlations))
partial_correlations *= d
partial_correlations *= d[:, np.newaxis]
non_zero = (np.abs(np.triu(partial_correlations, k=1)) > 0.02)

plt.scatter(embedding[0], embedding[1], s=100 * d ** 2, c=labels,
            cmap=plt.cm.spectral)

start_idx, end_idx = np.where(non_zero)

segments = [[embedding[:, start], embedding[:, stop]]
            for start, stop in zip(start_idx, end_idx)]
values = np.abs(partial_correlations[non_zero])
lc = LineCollection(segments,
                    zorder=0, cmap=plt.cm.hot_r,
                    norm=plt.Normalize(0, .7 * values.max()))
lc.set_array(values)
lc.set_linewidths(15 * values)
ax.add_collection(lc)

for index, (name, label, (x, y)) in enumerate(
        zip(names, labels, embedding.T)):
    dx = x - embedding[0]
    dx[index] = 1
    dy = y - embedding[1]
    dy[index] = 1
    this_dx = dx[np.argmin(np.abs(dy))]
    this_dy = dy[np.argmin(np.abs(dx))]
    if this_dx > 0:
        horizontalalignment = 'left'
        x = x + .002
    else:
        horizontalalignment = 'right'
        x = x - .002
    if this_dy > 0:
        verticalalignment = 'bottom'
        y = y + .002
    else:
        verticalalignment = 'top'
        y = y - .002
    plt.text(x, y, name, fontdict=font, size=10,
             horizontalalignment=horizontalalignment,
             verticalalignment=verticalalignment,
             bbox=dict(facecolor='w',
                       edgecolor=plt.cm.spectral(label / float(n_labels)),
                       alpha=.6))

plt.xlim(embedding[0].min() - .15 * embedding[0].ptp(),
         embedding[0].max() + .10 * embedding[0].ptp(),)
plt.ylim(embedding[1].min() - .03 * embedding[1].ptp(),
         embedding[1].max() + .03 * embedding[1].ptp())

plt.show()
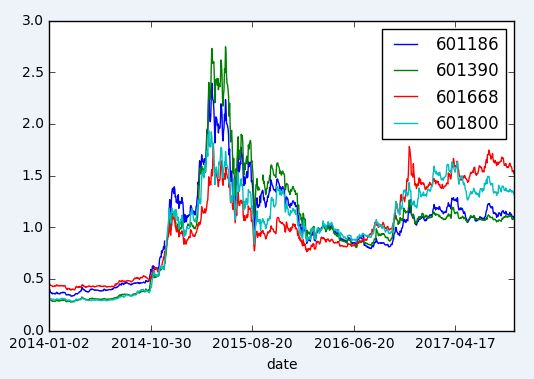
回头再看看被分类的股票
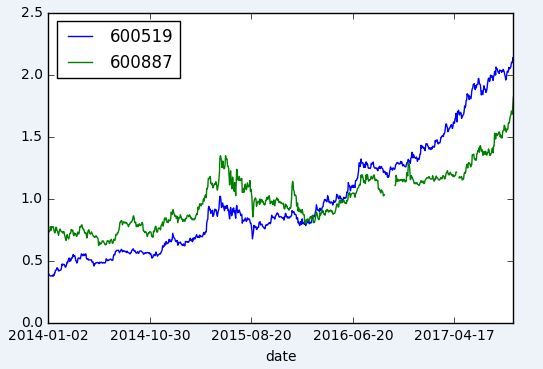
选出两组,看看所选时间段内是否真的走势相近
中国铁建, 中国中铁, 中国建筑, 中国交建
贵州茅台, 伊利股份
fit = [ True if name in [u'中国铁建', u'中国中铁', u'中国建筑', u'中国交建', u'贵州茅台', u'伊利股份'] else False for name in pool.name]
picked = pool[fit]
print picked
      code  name
14  600519  贵州茅台
18  600887  伊利股份
26  601186  中国铁建
34  601390  中国中铁
38  601668  中国建筑
42  601800  中国交建
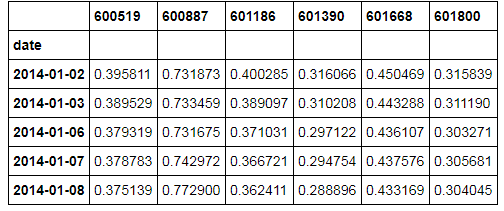
close = pd.DataFrame()
for code in picked.code:
    p = ts.get_k_data(code, d1, d2).set_index('date')['close']
    p = p/p.mean()
    p.name = code
    close = pd.concat([close, p], axis=1)
close.head()
close.loc[:,['600519','600887']].plot()
plt.show()
close.loc[:,['601186', '601390', '601668', '601800']].plot()
plt.show()
