生态学meta分析开源软件OpenMEE介绍
- 落后的统计方法以及无法升级的确定限制了生态学研究对过去meta分析软件的使用,作者开发的开源软件OpenMEE 拥有交互式平台,图形处理界面(GUI)。该软件虽然基于R,但并不需要使用者拥有R编程的知识。OpenMEE 为连续的或者分类的数据提供了更为先进的meta分析和meta回归的方法,如多协变量以及交互变量的meta回归分析、进化树、简单的缺失数据设算。软件还支持数据的输入和输出,数据探索分析,图形化以及表的汇总。
OpenMEE 使用简介
- 载入数据集
- 计算效应值(连续或二分类资料)
- Continuous outcome effect sizes: raw mean differences, Hedges’
d, log response ratios, bias-corrected log response ratios (Lajeunesse
2015). - Dichotomous outcome effect sizes: log odds ratio, rate differ
ence, log relative risk, arcsine transformed risk, raw and log-, logit-
or Arcsin-transformed proportions - Correlation coefficient transformation to Fisher’s-Z and back
transformation. - User-defined effect sizes are allowed if users provide
variances.
- 分析方法
- Fixed-effects modelling (simple inverse variance weighting).
- Random-effects modelling via any of the following estimators:
Maximum Likelihood, Hedges-Olkin, DerSimonian-Laird, Sidik-
Jonkman, Restricted Maximum Likelihood, or Empirical Bayes.
- Parametric estimation or non-parametric bootstrapping for the vari-
ances and confidence intervals of pooled effect sizes.
- Non-parametric randomization tests for heterogeneity statistics (Q-
test) in which observed effect sizes are resampled to assess the validity
of main effect tests.
- Phylogenetic meta-analysis that account for shared evolutionary his-
tory among species (Lajeunesse 2009).
- Automatic cumulative (Lau et al. 1992), leave-one-out and sub-group
meta-analyses.
- 具体示例如下:
- 打开软件
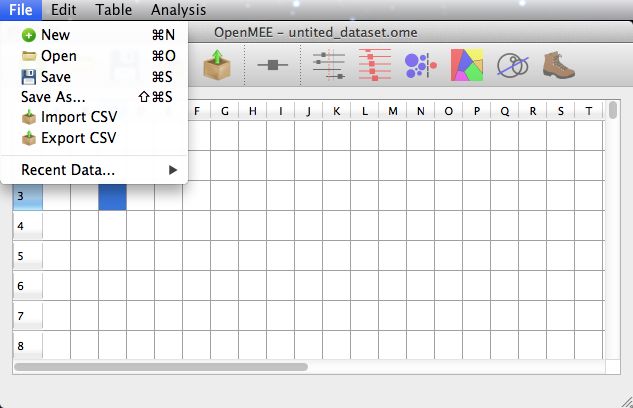
- 可以采用三种方式载入数据
手动输入
打开早先保存的 (.ome) 文件
导入CSV格式文件
如图:
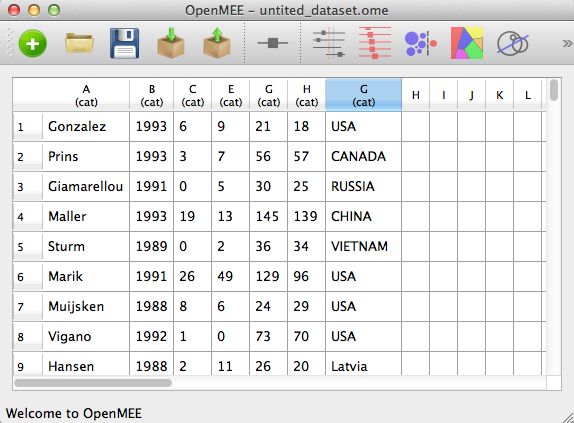
- 载入后的数据如下图所示,默认各列为cat属性
可以通过右键更改数据格式和列名
文本如下
context
更改数据类型,如下图所示数值列为 'counts' ,而'Country' and 'Year'分类变量, 'study_name'是标签.
- 计算效应值
- 输入 (i.e., not entering 'raw data')
- 根据raw data计算效应值
- 也可以通过手动输入
- 最终的表格如下所示:
Here we need to discuss the issue of 'transformed' scale vs. 'raw' scale. To perform a meta-analysis, we need an effect size and a measure of dispersion for each study. For example, if our metric is the odds ratio, we need the effect size on the transformed (log) scale because confidence intervals for odds ratios are generally not symmetric in the raw (untransformed) scale. Fortunately, OpenMEE can transform an effect size and confidence interval (or effect size and variance) from one scale another.
- 计算效应值
选中Establish linkage......,当你更改raw data时,效应值会随之改变
计算后的效应值如下:
*we see the result of transforming the effect size. Three new columns have been added containing the 'raw scale' effect size and upper and lower confidence bounds given the current confidence level shown in the toolbar. Changing the confidence level in the toolbar will cause the confidence interval to be recalculated.
- 输出CSV文件
In some cases, one may already have data that one would like to import for analysis. OpenMEE supports importing comma (and otherwise) delimited data. To achieve this, select Import CSV from the File menu. You will be prompted with a screen asking for details about your file format and its location, like so:
- meta相关的弹性分析,诸如:'bootstrapped' meta regression, meta-regression-based conditional means and boostrapped meta regression-based conditional means
- Standard Meta Analysis
Here we refer to analyses that look to estimate a 'grand mean', i.e., with no covariates. The pages you will see are as follows.
-
Data Type and Metric
-
Data Location
Refine studies/categories/exclude studies with specific missing data
Analysis Method and Parameters
Summary Page
- Cumulative Meta Analysis
Cumulative meta-analysis is a meta-analytic approach in which studies are added one at a time, and the change in the cumulative effect size is observed. To perform a cumulative meta-analysis in OpenMEE, simply select Cumulative Meta-Analysis from the Analysis menu. We show a sample forest plot generated from a cumulative meta-analysis below. The left-hand side displays the usual study estimates and confidence intervals; the right hand side shows the effect on the overall (summary) estimate as studies are included in the meta-analysis.
- Subgroup Meta Analysis
In subgroup meta-analysis, one partitions studies into disjoint groups (e.g., studies conducted in China versus all others) and runs separate meta-analyses over these groups of studies. This is an exploratory exercise that may highlight differences between groups. The options for subgroup meta analysis are the same as for standard meta analysis except for a categorical variable must be selected. For example, if the selected variable is state, then subgroup analyses will be run on studies from each observed state. In the example shown below, this includes Massachusetts (MA) and Rhode Island (RI).
Phylogenetic Meta Analysis
phylogenetic meta-analysis
Choose effect size and variance and also a species column
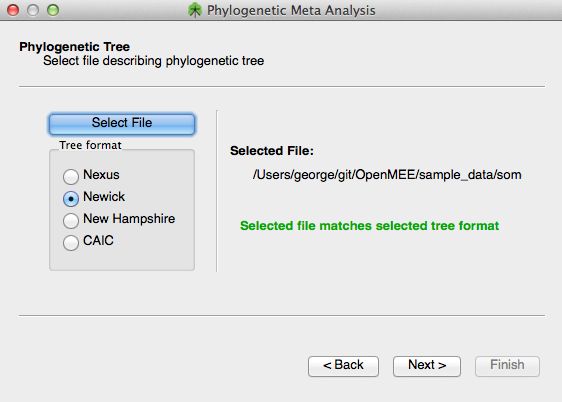
Choose a phylogenetic tree file
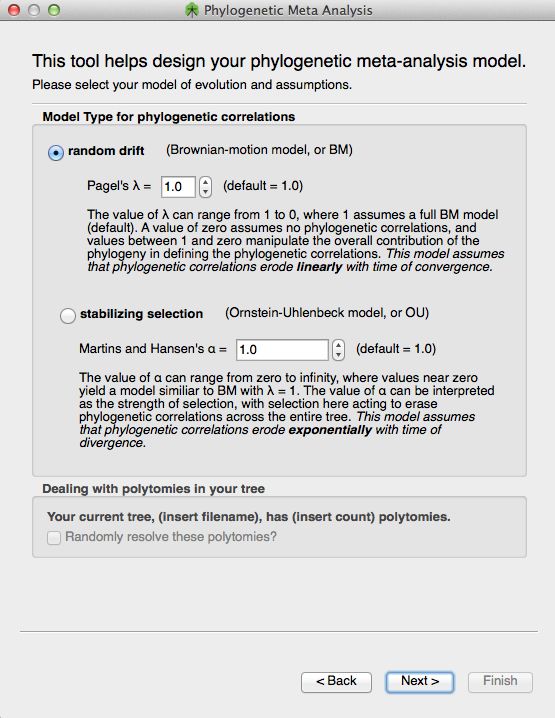
Specify phylogenetic
model type
Meta Regression
Meta-regression allows one to explore the relationship between covariates and study outcomes. OpenMEE supports mulitple regression and both continuous and categorical predictors (covariates).
On the 'Select covariates for regression page', select the covariates for regression. On this same page, one can choose whether you want to use a random or fixed effects model and the confidence level to use in the analysis. An example of this is shown below; here we have selected "Avg. Rainfall" to be included in the regression.
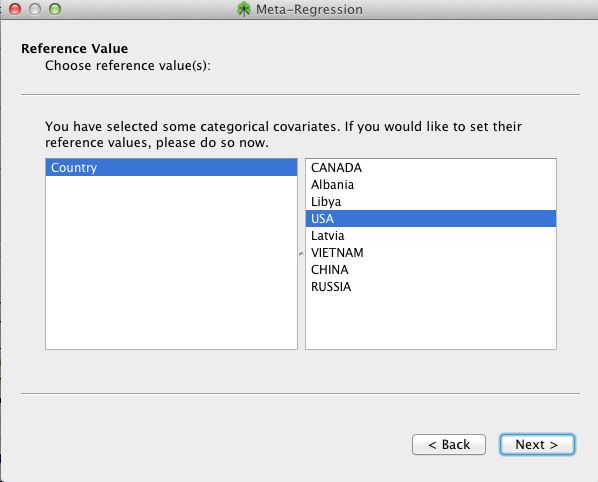
For any categorical covariates that have been selected to be included in the meta-regression, one needs to specify the value that will serve as its reference value (i.e., the intercept). We show an example below where the covariate is Country and the reference value has been specified as USA.
We note that one can also assess the variance of regression coefficient estimates via bootstrapping (see below). To do so, simply select 'bootstrap' rather 'parametric' under 'Type of Analysis' when specifying meta-regression options. We show an example of bootstrap output for the rainfall predictor below.
Model Building
OpenMEE can compare two regression-models in terms of model-fit statistics and a likelihood ratio test. This is a strategy to assess the informativeness of a given (set of) predictors.
The process to do this model building comparison is very similiar to that of meta-regression. The only differences are that the covariates you select on the covariate select screen will be the covariates used to construct the Full model. You then select a subset of these covariates/interactions to use for the reduced model as shown in the figure.
Specifying the 'reduced' model
Boostrapped Meta Analysis
Bootstrapping is a non-parametric approach for assessing the variance of a parameter estimate. OpenMEE allows for bootstrapped estimates both for meta-regressions and standard meta-analysis.
In general, the options for boostrapped meta-analysis are the same as those for standard meta-analysis, with the addition that one needs to provide bootstrap-specific parameter values. These include the number of bootstrap replicates to perform, for example. We show sample output from a boostrapped meta-analysis below.
When running bootstrap operations in OpenMEE, the program tries to generate results using the selected number of bootstrap replicates. We note that depending on the dataset and the meta-anaytic (pooling) model being used, a meta-analysis of a specific sample of the dataset may fail. OpenMEE hands this in a straight-forward way: if one particular replicate attempt fails, another is tried, and so on until 5 times the selected of bootstrap replicates have been attempted, at which point an error message is returned.
Multiple Imputation
Sometimes data elements are missing from studies. OpenMEE supports basic imputation of covariates for meta-regression. To use this, select Multiple Imputations Meta-Regression form the Analysis drop-down menu. You will be prompted with the following screen
These parameters specify the imputation method to use and the number of multiple imputations to perform. Providing the methodological details of the imputation is beyond the scope of this document, but we refer the interested reader to the R MICE documentation for more details: we use this package 'under the hood' to perform the imputation.
Publication Bias
OpenMEE includes the standard tools for publication bias diagnostics, including funnel plots. These can be generated by selecting the Funnel Plot option under the Publication Bias sub-menu of Data Exploration. Example output is shown below. We caution users to interpret these with care, and to read this criticism of funnel plots.
Under the same Publication Bias sub-menu, one can find an option to calculate fail-safe N
参考资料
OpenMEE: Intuitive, open‐source software for meta‐analysis in ecology and evolutionary biology
https://mp.weixin.qq.com/s/KCLAnQsaLnRBomU1EdZwYg
https://mp.weixin.qq.com/s/4nn1Zof3AKZ29sgpKuki6w

