项目来源于《数据分析与挖掘实战》。
1.背景与挖掘目标
通过电力计量自动化系统以及异常警告信息等数据提取出窃漏电用户的关键特征,构建窃漏电用户的识别模型,自动检查、判断用户是否存在窃漏电行为。
2.分析方法与过程
- 从电力计量自动化系统、营销系统有选择地抽取部分大用户用电负荷、终端报警及违约窃电处罚信息等原始数据。
- 对样本进行探索性分析,剔除不可能存在窃漏电行为行业的用户。
- 对样本数据进行预处理,包括数据清洗、缺失值处理和数据变换。
- 构建专家样本集。(构建好的特征,整理好的数据)
- 构建窃漏电用户模型。
- 在线监测用户用电负荷及终端报警,调用模型实现实时诊断。
2.3 数据变换
通过数据探索分析并结合实际业务找出三个与用户窃漏电有关的三个指标。
- 电量趋势下降指标。 如果电量趋势不断下降,则有窃电可能
- 线损指标。若若用户发生窃漏电,则当天的线损率会上升。考虑前后几天的线损率平均值,判断其增长率是否大于1%,若线损率的增长率大于1%则有窃漏电的可能性。
- 告警类指标。与窃漏电相关的终端主要有电压、电压断相、电流烦极性等告警,计算发生与窃漏电相关的终端报警的次数总和。
2.5 建立模型
思路如下:
1 导入数据
2 用训练数据建立决策树模型
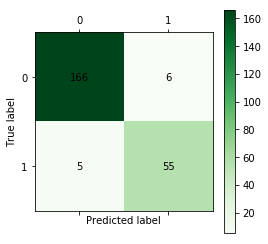
3 对训练数据用混淆矩阵评估决策树模型的预测结果
4 用训练数据建立神经网络模型
5 对训练数据用混淆矩阵评估神经网络模型的预测结果
6 用学习得到的决策树模型和神经网络模型跑测试数据来预测
7 用ROC曲线评估,选出更优的一个模型
代码如下:
导入数据
import pandas as pd
import numpy as np
data = pd.read_excel('G:/Python_data_analysis/chapter6/chapter6/demo/data/model.xls')
data = data.as_matrix()
from random import shuffle
shuffle(data)   #随机打乱数据
p = 0.8
train = data[:int(len(data)*p),:]
test = data[int(len(data)*p): ,:]
绘制混淆矩阵函数
def cm_plot(y,yp):
    from sklearn.metrics import confusion_matrix
    cm = confusion_matrix(y,yp)
    import matplotlib.pyplot as plt
    plt.matshow(cm,cmap=plt.cm.Greens) #画混淆矩阵,配色风格使用cm.Greens
    plt.colorbar() #颜色标签
    for x in range(len(cm)):
        for y in range(len(cm)):
            plt.annotate(cm[x,y], xy=(x, y), horizontalalignment='center', verticalalignment='center')
    plt.ylabel('True label')
    plt.xlabel('Predicted label')
    return plt
用数据训练决策树模型
from sklearn.tree import DecisionTreeClassifier

tree = DecisionTreeClassifier()
tree.fit(train[:,:3],train[:,3])

cm_plot(train[:,3], tree.predict(train[:,:3])).show()
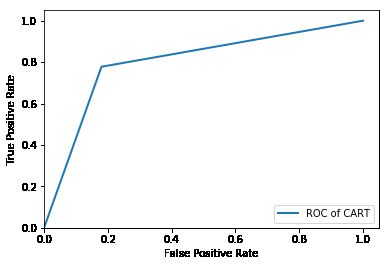
决策树roc曲线
from sklearn.metrics import roc_curve

predict_result = tree.predict(test[:,:3]).reshape(len(test))
fpr, tpr, thresholds = roc_curve(test[:,3], predict_result, pos_label=1)
plt.plot(fpr, tpr, linewidth=2, label = 'ROC of CART')
plt.xlabel('False Positive Rate')
plt.ylabel('True Positive Rate')
plt.ylim(0,1.05)
plt.xlim(0,1.05)
plt.legend(loc=4)
plt.show()
用数据训练lm神经网络模型
# 构建LM神经网络模型代码
from keras.models import Sequential
from keras.layers.core import Dense, Activation #导入神经网络层函数、激活函数

net = Sequential()  #建立神经网络
net.add(Dense(input_dim=3, output_dim=10))  #添加输入层(3节层)到隐藏层(10节点)的连接
net.add(Activation('relu')) #隐藏层使用relu激活函数
net.add(Dense(input_dim=10, output_dim=1)) #添加隐藏层(10节点)到输出层(1节点)的连接
net.add(Activation('sigmoid')) #输出层使用sigmoid激活函数
net.compile(loss = 'binary_crossentropy',optimizer = 'adam')

net.fit(train[:,:3],train[:,3],nb_epoch=1000, batch_size=1)

cm_plot(train[:,3],net.predict_classes([train[:,:3].reshape(len(train))
from sklearn.metrics import roc_curve

predict_result = net.predict(test[:,:3]).reshape(len(test))
fpr, tpr, thresholds = roc_curve(test[:,3], predict_result, pos_label=1)
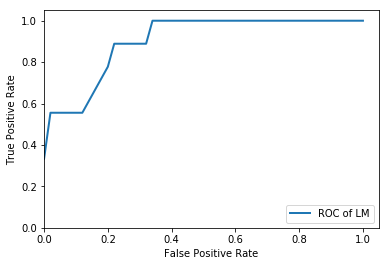
plt.plot(fpr, tpr, linewidth=2, label = 'ROC of LM')
plt.xlabel('False Positive Rate')
plt.ylabel('True Positive Rate')
plt.ylim(0,1.05)
plt.xlim(0,1.05)
plt.legend(loc=4)
plt.show()
对比神经网络和决策树的ROC曲线,可以发现LM神经网络曲线效果较好。
比较好的一篇文章:机器学习-浅谈模型评估的方法和指标


