LSTM Neural Network for Accelerometer Data Processing
You know first-hand that smartphones have auto-rotate settings. When you play mobile games, you can manage movements via the phone's rotation. Smartphones contain a special sensor called an accelerometer for supporting automatic orientation of the screen. The accelerometer measures acceleration of the object. Modern engineers collect data on mobile phones’ orientation changes to learn the way smartphone owners move. The data can be applied for software development in different areas — from providing security up to geolocation services.
How can we automate and systematize accelerometer data processing?
While answering this question we decided to test various LSTM neural network models for sensor data processing.
The goal of our research is to test whether the LSTM neural network can process the accelerometer sensor data and can be used to determine the type of mobile objects movements.
The goal of our research is to to test whether the LSTM neural network can process the accelerometer sensor data and can be used to determine the type of mobile objects movements.
Research Overview
- Identifying the main hypothesis2. Accelerometer data visual analysis3. LSTM neural network training4. Results of LSTM network testing for the testing mobile app
Identifying the Main Hypothesis
In theory, an accelerometer is a device measuring sum of object acceleration and gravity acceleration. The primary accelerometer looks like a weight suspended on a spring and supported from the other side to inhibit vibrations. Usually, smartphones have embedded MEMS accelerometers.
Image 1: The model of the primary accelerometer
Accelerometers can be single-, two-, and three-axis meaning that acceleration can be measured along with one, two, or three axises. Most smartphones typically make use of three-axis models.
We’ve used the accelerometer to determine whether a smartphone was moving or not and to see the speed of the movements.
When you give an acceleration to the smartphone – you take it up from the table or twist it in the air, the phone’s springs are stretching and compressing in a specific way. Considering the specifics of smartphone’s movements, we formulated the hypothesis.
The main hypothesis: if a smartphone is located inside a pocket of the moving object, oscillations are transmitted to the smartphone and displayed in the accelerometer data.
Accelerometer Data Visual Analysis
We analyzed the collected accelerometer data in accordance with the main hypothesis.
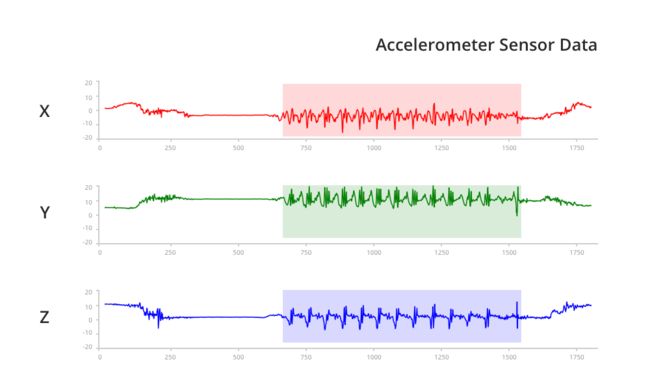
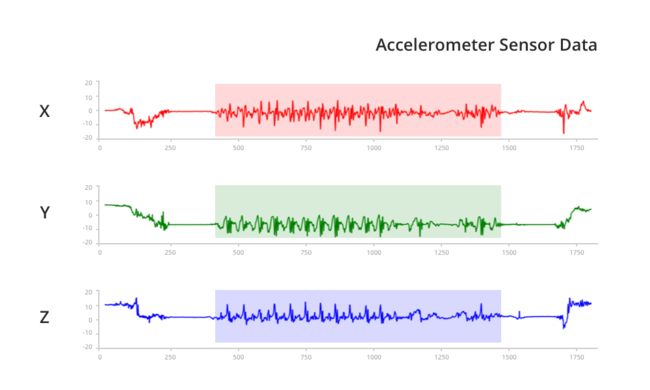
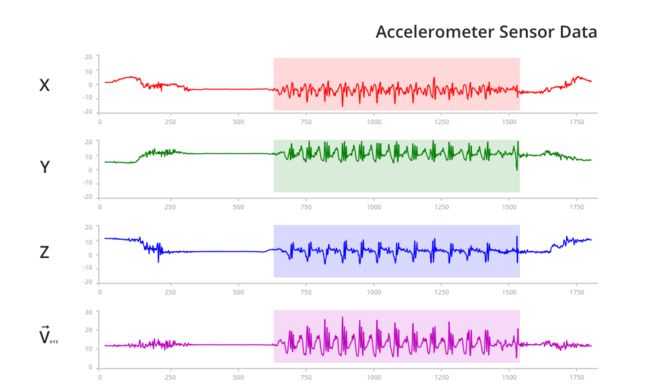
We found in the following pattern in the data. In the moment of making a step, an oscillation of a big amplitude occurs and then disappears till the next step is made. This pattern is repeated on all the graphs:
Walk 1. In the range of 600 to 1300
Walk 2. In the range of 500 to 1300
Walk 3. In the range of 300 to 1500
However, various factors can add some noise to the accelerometer data processing. For example, the phone can be located inside the pocket and sit differently. In this case, graphs for all the three axes with the same model of object movements will look differently to how it’s shown on the images.
If you look at the Y-axis on the graphs, then you’ll see that the phone was located in different positions. For this reason, it was required to find a feature that doesn’t depend on the smartphone’s position and shows the specific pattern for various types of human movements at the same time. The magnitude of the vector was chosen as the required feature. The vector starts from the origin and goes to the point with X, Y, Z coordinates from the accelerometer sensor data.
As you can see from graph, the vector magnitude doesn’t depend on the smartphone position.
LSTM Neural Network Training
To solve the task, we made a dataset divided into the training and testing sets. Then we started to train the LSTM neural network.
All the models have the same structure of the network layers: the input vector goes to the LSTM layer and then a signal goes to the fully connected layer where the answer comes from. Detailed information can be found, for instance, on the website of Lasagne framework.
To get the optimal model we wrote a script that created new models by changing the number of inputs in neural networks and the LSTM-elements number. We created and trained all the model types several times to avoid entering local minimum while using the solver and finding the optimal set of the network weights.
All the models are implemented using Python with frameworks Theano and Lasagne. We’ve also applied the Adam solver. The differences between models are the size of input vector and the LSTM-elements number.
We then tested received models with a special Android testing app. To run the solution on Android, we chose the following libraries:
JBLAS is a linear algebra library based on BLAS (Basic Linear Algebra Subprograms)
JAMA – Java Matrix Package
The library JBLAS showed an error message when the program was running on the arm64 architecture. Finally, we implemented the solution using JAMA.
Results of LSTM Network Testing for the Testing Mobile App
Results of LSTM network testing demonstrated that the received models cope well with the accelerometer data processing tasks.
Using the models, we can define the type of mobile object movements: rest, on foot, driving, etc. This is explained via a specific pattern that appears in the oscillations of vector length that are calculated with accelerometer data in driving or rest periods.
When it relates to on foot or the rest, a pattern is quite easily followed. When it relates to a transport trip (subway, bus, or car), the precision of estimation falls down as different factors influence the correct evaluation of the human state.
Usually, a man doesn’t move in the transport. Hence, most of the way will be shown as rest. However, if a man is in a shaky type of transport, the vibration will transmit to the smartphone and the neural network will define the movement type as transport. When it relates to the car, a driver can allocate the phone on the control panel. In this case, the pattern transport will be better followed.


