通过本手册,你将收获以下知识:
- matplotlib 及环境配置
- 数据图的组成结构,与 matplotlib 对应的名称
- 常见的数据绘图类型,与绘制方法
您可能需要以下的准备与先修知识:
- Python开发环境及matplotlib工具包
- Python基础语法
- Python numpy 包使用
1.matplotlib安装配置
linux可以通过以下方式安装matplotlib
sudo pip install numpy
sudo pip install scipy
sudo pip install matplotlib
windows墙裂推荐大家使用anaconda
2.一副可视化图的基本结构
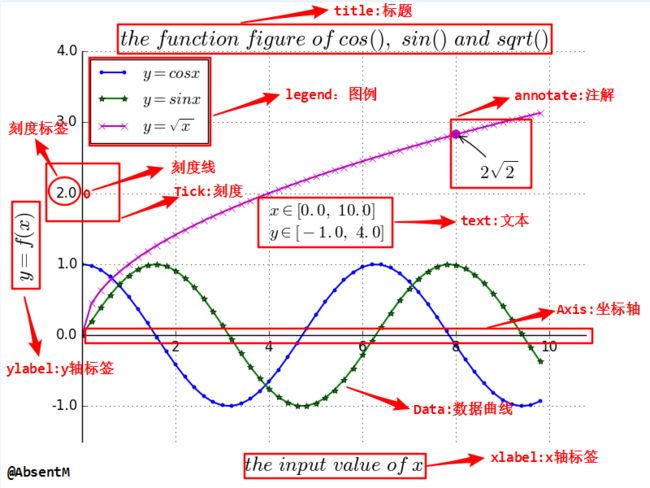
通常,使用 numpy 组织数据, 使用 matplotlib API 进行数据图像绘制。 一幅数据图基本上包括如下结构:
- Data: 数据区,包括数据点、描绘形状
- Axis: 坐标轴,包括 X 轴、 Y 轴及其标签、刻度尺及其标签
- Title: 标题,数据图的描述
- Legend: 图例,区分图中包含的多种曲线或不同分类的数据
其他的还有图形文本 (Text)、注解 (Annotate)等其他描述
3.画法
下面以常规图为例,详细记录作图流程及技巧。按照绘图结构,可将数据图的绘制分为如下几个步骤:
- 导入 matplotlib 包相关工具包
- 准备数据,numpy 数组存储
- 绘制原始曲线
- 配置标题、坐标轴、刻度、图例
- 添加文字说明、注解
- 显示、保存绘图结果
3.1 导包
会用到 matplotlib.pyplot、pylab 和 numpy
#coding:utf-8
%matplotlib inline
import numpy as np
import matplotlib.pyplot as plt
from pylab import *
3.2 准备数据
numpy 常用来组织源数据:
# 定义数据部分
x = np.arange(0., 10, 0.2)
y1 = np.cos(x)
y2 = np.sin(x)
y3 = np.sqrt(x)

#x = all_df['house_age']
#y = all_df['house_price']
3.3绘制基本曲线
使用 plot 函数直接绘制上述函数曲线,可以通过配置 plot 函数参数调整曲线的样式、粗细、颜色、标记等:
# 绘制 3 条函数曲线
# $y=\sqrt{x}$
plt.rcParams["figure.figsize"] = (12,8)
plt.plot(x, y1, color='blue', linewidth=1.5, linestyle='-', marker='.', label=r'$y = cos{x}$')
plt.plot(x, y2, color='green', linewidth=1.5, linestyle='-', marker='*', label=r'$y = sin{x}$')
plt.plot(x, y3, color='m', linewidth=1.5, linestyle='-', marker='x', label=r'$y = \sqrt{x}$')
3.3.1 关于颜色的补充
主要是color参数:
- r 红色
- g 绿色
- b 蓝色
- c cyan
- m 紫色
- y 土黄色
- k 黑色
- w 白色
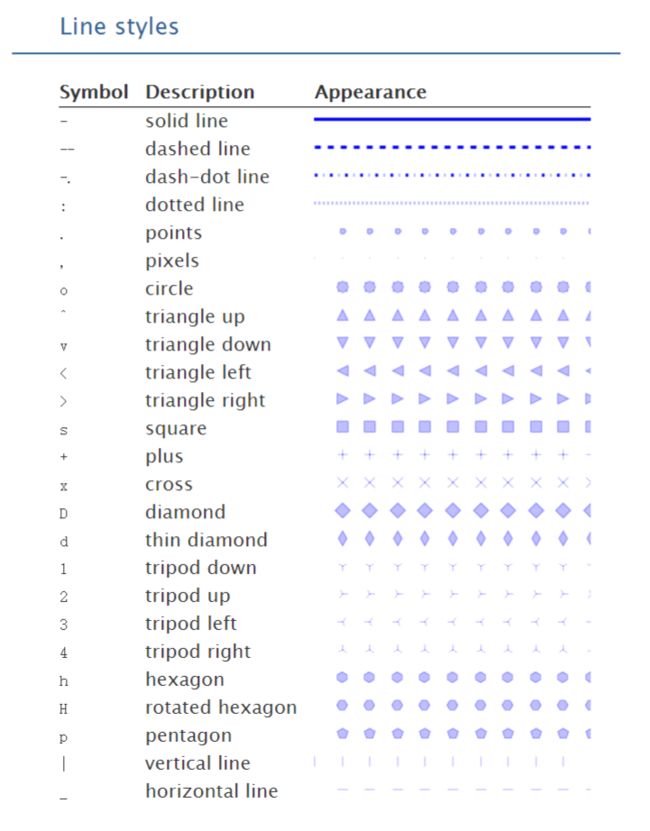
3.3.2 linestyle参数
linestyle 参数主要包含虚线、点化虚线、粗虚线、实线,如下:
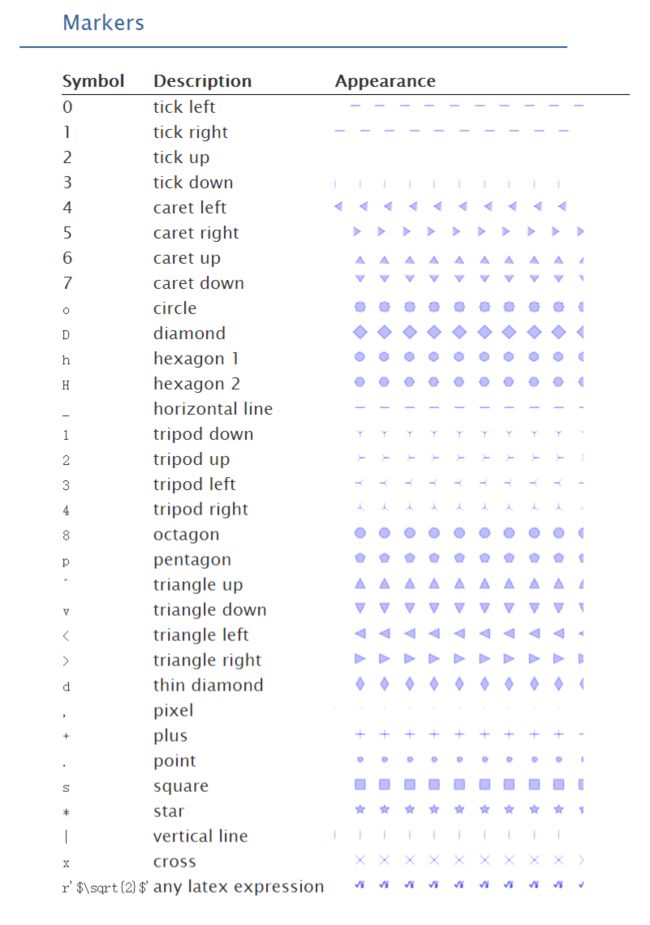
3.3.3 marker参数
marker参数设定在曲线上标记的特殊符号,以区分不同的线段。常见的形状及表示符号如下图所示:
3.4 设置坐标轴
可通过如下代码,移动坐标轴 spines
# 坐标轴上移
ax = plt.subplot(111)
#ax = plt.subplot(2,2,1)
ax.spines['right'].set_color('none')     # 去掉右边的边框线
ax.spines['top'].set_color('none')       # 去掉上边的边框线
# 移动下边边框线,相当于移动 X 轴
ax.xaxis.set_ticks_position('bottom')
ax.spines['bottom'].set_position(('data', 0))
# 移动左边边框线,相当于移动 y 轴
ax.yaxis.set_ticks_position('left')
ax.spines['left'].set_position(('data', 0))
可通过如下代码,设置刻度尺间隔 lim、刻度标签 ticks
# 设置 x, y 轴的刻度取值范围
plt.xlim(x.min()*1.1, x.max()*1.1)
plt.ylim(-1.5, 4.0)
# 设置 x, y 轴的刻度标签值
plt.xticks([2, 4, 6, 8, 10], [r'two', r'four', r'6', r'8', r'10'])
plt.yticks([-1.0, 0.0, 1.0, 2.0, 3.0, 4.0],
    [r'-1.0', r'0.0', r'1.0', r'2.0', r'3.0', r'4.0'])
可通过如下代码,设置 X、Y 坐标轴和标题:
# 设置标题、x轴、y轴
plt.title(r'$the \ function \ figure \ of \ cos(), \ sin() \ and \ sqrt()$', fontsize=19)
plt.xlabel(r'$the \ input \ value \ of \ x$', fontsize=18, labelpad=88.8)
plt.ylabel(r'$y = f(x)$', fontsize=18, labelpad=12.5)
3.5 设置文字描述、注解
可通过如下代码,在数据图中添加文字描述 text:
plt.text(0.8, 0.9, r'$x \in [0.0, \ 10.0]$', color='k', fontsize=15)
plt.text(0.8, 0.8, r'$y \in [-1.0, \ 4.0]$', color='k', fontsize=15)
可通过如下代码,在数据图中给特殊点添加注解 annotate:
# 特殊点添加注解
plt.scatter([8,],[np.sqrt(8),], 50, color ='m')  # 使用散点图放大当前点
plt.annotate(r'$2\sqrt{2}$', xy=(8, np.sqrt(8)), xytext=(8.5, 2.2), fontsize=16, color='#090909', arrowprops=dict(arrowstyle='->', connectionstyle='arc3, rad=0.1', color='#090909'))
3.6 设置图例
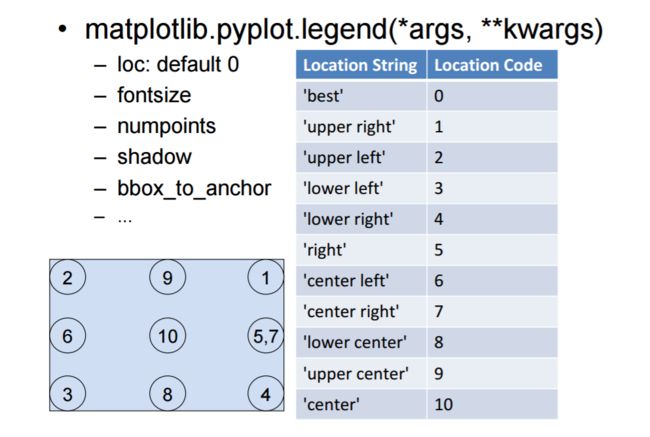
可使用如下两种方式,给绘图设置图例:
- 1: 在 plt.plot 函数中添加 label 参数后,使用 plt.legend(loc=’up right’)
- 2: 不使用参数 label, 直接使用如下命令:
plt.legend(['cos(x)', 'sin(x)', 'sqrt(x)'], loc='upper right')
3.7 网格线开关
可使用如下代码,给绘图设置网格线:
# 显示网格线
plt.grid(True)
3.8 显示与图像保存
plt.show()    # 显示
#savefig('../figures/plot3d_ex.png',dpi=48)    # 保存,前提目录存在
4. 完整的绘制程序
#coding:utf-8

import numpy as np
import matplotlib.pyplot as plt
from pylab import *

# 定义数据部分
x = np.arange(0., 10, 0.2)
y1 = np.cos(x)
y2 = np.sin(x)
y3 = np.sqrt(x)

# 绘制 3 条函数曲线
plt.plot(x, y1, color='blue', linewidth=1.5, linestyle='-', marker='.', label=r'$y = cos{x}$')
plt.plot(x, y2, color='green', linewidth=1.5, linestyle='-', marker='*', label=r'$y = sin{x}$')
plt.plot(x, y3, color='m', linewidth=1.5, linestyle='-', marker='x', label=r'$y = \sqrt{x}$')

# 坐标轴上移
ax = plt.subplot(111)
ax.spines['right'].set_color('none')     # 去掉右边的边框线
ax.spines['top'].set_color('none')       # 去掉上边的边框线

# 移动下边边框线,相当于移动 X 轴
ax.xaxis.set_ticks_position('bottom')
ax.spines['bottom'].set_position(('data', 0))

# 移动左边边框线,相当于移动 y 轴
ax.yaxis.set_ticks_position('left')
ax.spines['left'].set_position(('data', 0))

# 设置 x, y 轴的取值范围
plt.xlim(x.min()*1.1, x.max()*1.1)
plt.ylim(-1.5, 4.0)

# 设置 x, y 轴的刻度值
plt.xticks([2, 4, 6, 8, 10], [r'2', r'4', r'6', r'8', r'10'])
plt.yticks([-1.0, 0.0, 1.0, 2.0, 3.0, 4.0],
    [r'-1.0', r'0.0', r'1.0', r'2.0', r'3.0', r'4.0'])

# 添加文字
plt.text(0.8, 0.8, r'$x \in [0.0, \ 10.0]$', color='k', fontsize=15)
plt.text(0.8, 0.9, r'$y \in [-1.0, \ 4.0]$', color='k', fontsize=15)

# 特殊点添加注解
plt.scatter([8,],[np.sqrt(8),], 50, color ='m')  # 使用散点图放大当前点
plt.annotate(r'$2\sqrt{2}$', xy=(8, np.sqrt(8)), xytext=(8.5, 2.2), fontsize=16, color='#090909', arrowprops=dict(arrowstyle='->', connectionstyle='arc3, rad=0.1', color='#090909'))

# 设置标题、x轴、y轴
plt.title(r'$the \ function \ figure \ of \ cos(), \ sin() \ and \ sqrt()$', fontsize=19)
plt.xlabel(r'$the \ input \ value \ of \ x$', fontsize=18, labelpad=88.8)
plt.ylabel(r'$y = f(x)$', fontsize=18, labelpad=12.5)

# 设置图例及位置
plt.legend(loc='up right')
# plt.legend(['cos(x)', 'sin(x)', 'sqrt(x)'], loc='up right')

# 显示网格线
plt.grid(True)

# 显示绘图
plt.show()
5.常用图像
细节看这里,看这里,看这里
想成为可视化专家的你,工具手册在哪里?在这里!更全的在这里
- 曲线图:matplotlib.pyplot.plot(data)
- 灰度图:matplotlib.pyplot.hist(data)
- 散点图:matplotlib.pyplot.scatter(data)
- 箱式图:matplotlib.pyplot.boxplot(data)
x = np.arange(-5,5,0.1)
y = x ** 2
plt.plot(x,y)

x = np.random.normal(size=1000)
plt.hist(x, bins=10)

plt.rcParams["figure.figsize"] = (8,8)
x = np.random.normal(size=1000)
y = np.random.normal(size=1000)
plt.scatter(x,y)

plt.boxplot(x)
箱式图科普
- 上边缘(Q3+1.5IQR)、下边缘(Q1-1.5IQR)、IQR=Q3-Q1
- 上四分位数(Q3)、下四分位数(Q1)
- 中位数
- 异常值
- 处理异常值时与标准的异同:统计边界是否受异常值影响、容忍度的大小
6.案例:自行车租赁数据分析与可视化
step1. 导入数据,做简单的数据处理
import pandas as pd # 读取数据到DataFrame
import urllib # 获取网络数据
import tempfile # 创建临时文件系统
import shutil # 文件操作
import zipfile # 压缩解压

temp_dir = tempfile.mkdtemp() # 建立临时目录
data_source = 'http://archive.ics.uci.edu/ml/machine-learning-databases/00275/Bike-Sharing-Dataset.zip' # 网络数据地址
zipname = temp_dir + '/Bike-Sharing-Dataset.zip' # 拼接文件和路径
urllib.urlretrieve(data_source, zipname) # 获得数据

zip_ref = zipfile.ZipFile(zipname, 'r') # 创建一个ZipFile对象处理压缩文件
zip_ref.extractall(temp_dir) # 解压
zip_ref.close()

daily_path = 'data/day.csv'
daily_data = pd.read_csv(daily_path) # 读取csv文件
daily_data['dteday'] = pd.to_datetime(daily_data['dteday']) # 把字符串数据传换成日期数据
drop_list = ['instant', 'season', 'yr', 'mnth', 'holiday', 'workingday', 'weathersit', 'atemp', 'hum'] # 不关注的列
daily_data.drop(drop_list, inplace = True, axis = 1) # inplace=true在对象上直接操作

shutil.rmtree(temp_dir) # 删除临时文件目录

daily_data.head() # 看一看数据~
step2. 配置参数
from __future__ import division, print_function # 引入3.x版本的除法和打印
from matplotlib import pyplot as plt
import pandas as pd
import numpy as np
# 在notebook中显示绘图结果
%matplotlib inline

# 设置一些全局的资源参数,可以进行个性化修改
import matplotlib
# 设置图片尺寸 14" x 7"
# rc: resource configuration
matplotlib.rc('figure', figsize = (14, 7))
# 设置字体 14
matplotlib.rc('font', size = 14)
# 不显示顶部和右侧的坐标线
matplotlib.rc('axes.spines', top = False, right = False)
# 不显示网格
matplotlib.rc('axes', grid = False)
# 设置背景颜色是白色
matplotlib.rc('axes', facecolor = 'white')
step3. 关联分析
散点图
- 分析变量关系
from matplotlib import font_manager
fontP = font_manager.FontProperties()
fontP.set_family('SimHei')
fontP.set_size(14)

# 包装一个散点图的函数便于复用
def scatterplot(x_data, y_data, x_label, y_label, title):

    # 创建一个绘图对象
    fig, ax = plt.subplots()

    # 设置数据、点的大小、点的颜色和透明度
    ax.scatter(x_data, y_data, s = 10, color = '#539caf', alpha = 0.75) # http://www.114la.com/other/rgb.htm

    # 添加标题和坐标说明
    ax.set_title(title)
    ax.set_xlabel(x_label)
    ax.set_ylabel(y_label)

# 绘制散点图
scatterplot(x_data = daily_data['temp']
            , y_data = daily_data['cnt']
            , x_label = 'Normalized temperature (C)'
            , y_label = 'Check outs'
            , title = 'Number of Check Outs vs Temperature')
曲线图
- 拟合变量关系
# 线性回归
import statsmodels.api as sm # 最小二乘
from statsmodels.stats.outliers_influence import summary_table # 获得汇总信息
x = sm.add_constant(daily_data['temp']) # 线性回归增加常数项 y=kx+b
y = daily_data['cnt']
regr = sm.OLS(y, x) # 普通最小二乘模型,ordinary least square model
res = regr.fit()
# 从模型获得拟合数据
st, data, ss2 = summary_table(res, alpha=0.05) # 置信水平alpha=5%,st数据汇总,data数据详情,ss2数据列名
fitted_values = data[:,2]

# 包装曲线绘制函数
def lineplot(x_data, y_data, x_label, y_label, title):
    # 创建绘图对象
    _, ax = plt.subplots()

    # 绘制拟合曲线,lw=linewidth,alpha=transparancy
    ax.plot(x_data, y_data, lw = 2, color = '#539caf', alpha = 1)

    # 添加标题和坐标说明
    ax.set_title(title)
    ax.set_xlabel(x_label)
    ax.set_ylabel(y_label)

# 调用绘图函数
lineplot(x_data = daily_data['temp']
         , y_data = fitted_values
         , x_label = 'Normalized temperature (C)'
         , y_label = 'Check outs'
         , title = 'Line of Best Fit for Number of Check Outs vs Temperature')
x.head()
type(regr)
st
带置信区间的曲线图
- 评估曲线拟合结果
# 获得5%置信区间的上下界
predict_mean_ci_low, predict_mean_ci_upp = data[:,4:6].T

# 创建置信区间DataFrame,上下界
CI_df = pd.DataFrame(columns = ['x_data', 'low_CI', 'upper_CI'])
CI_df['x_data'] = daily_data['temp']
CI_df['low_CI'] = predict_mean_ci_low
CI_df['upper_CI'] = predict_mean_ci_upp
CI_df.sort_values('x_data', inplace = True) # 根据x_data进行排序

# 绘制置信区间
def lineplotCI(x_data, y_data, sorted_x, low_CI, upper_CI, x_label, y_label, title):
    # 创建绘图对象
    _, ax = plt.subplots()

    # 绘制预测曲线
    ax.plot(x_data, y_data, lw = 1, color = '#539caf', alpha = 1, label = 'Fit')
    # 绘制置信区间,顺序填充
    ax.fill_between(sorted_x, low_CI, upper_CI, color = '#539caf', alpha = 0.4, label = '95% CI')
    # 添加标题和坐标说明
    ax.set_title(title)
    ax.set_xlabel(x_label)
    ax.set_ylabel(y_label)

    # 显示图例,配合label参数,loc=“best”自适应方式
    ax.legend(loc = 'best')

# Call the function to create plot
lineplotCI(x_data = daily_data['temp']
           , y_data = fitted_values
           , sorted_x = CI_df['x_data']
           , low_CI = CI_df['low_CI']
           , upper_CI = CI_df['upper_CI']
           , x_label = 'Normalized temperature (C)'
           , y_label = 'Check outs'
           , title = 'Line of Best Fit for Number of Check Outs vs Temperature')
双坐标曲线图
- 曲线拟合不满足置信阈值时,考虑增加独立变量
*分析不同尺度多变量的关系
# 双纵坐标绘图函数
def lineplot2y(x_data, x_label, y1_data, y1_color, y1_label, y2_data, y2_color, y2_label, title):
    _, ax1 = plt.subplots()
    ax1.plot(x_data, y1_data, color = y1_color)
    # 添加标题和坐标说明
    ax1.set_ylabel(y1_label, color = y1_color)
    ax1.set_xlabel(x_label)
    ax1.set_title(title)

    ax2 = ax1.twinx() # 两个绘图对象共享横坐标轴
    ax2.plot(x_data, y2_data, color = y2_color)
    ax2.set_ylabel(y2_label, color = y2_color)
    # 右侧坐标轴可见
    ax2.spines['right'].set_visible(True)

# 调用绘图函数
lineplot2y(x_data = daily_data['dteday']
           , x_label = 'Day'
           , y1_data = daily_data['cnt']
           , y1_color = '#539caf'
           , y1_label = 'Check outs'
           , y2_data = daily_data['windspeed']
           , y2_color = '#7663b0'
           , y2_label = 'Normalized windspeed'
           , title = 'Check Outs and Windspeed Over Time')
step4. 分布分析
灰度图
- 粗略区间计数
# 绘制灰度图的函数
def histogram(data, x_label, y_label, title):
    _, ax = plt.subplots()
    res = ax.hist(data, color = '#539caf', bins=10) # 设置bin的数量
    ax.set_ylabel(y_label)
    ax.set_xlabel(x_label)
    ax.set_title(title)
    return res

# 绘图函数调用
res = histogram(data = daily_data['registered']
           , x_label = 'Check outs'
           , y_label = 'Frequency'
           , title = 'Distribution of Registered Check Outs')
res[0] # value of bins
res[1] # boundary of bins
堆叠直方图
- 比较两个分布
# 绘制堆叠的直方图
def overlaid_histogram(data1, data1_name, data1_color, data2, data2_name, data2_color, x_label, y_label, title):
    # 归一化数据区间,对齐两个直方图的bins
    max_nbins = 10
    data_range = [min(min(data1), min(data2)), max(max(data1), max(data2))]
    binwidth = (data_range[1] - data_range[0]) / max_nbins
    bins = np.arange(data_range[0], data_range[1] + binwidth, binwidth) # 生成直方图bins区间

    # Create the plot
    _, ax = plt.subplots()
    ax.hist(data1, bins = bins, color = data1_color, alpha = 1, label = data1_name)
    ax.hist(data2, bins = bins, color = data2_color, alpha = 0.75, label = data2_name)
    ax.set_ylabel(y_label)
    ax.set_xlabel(x_label)
    ax.set_title(title)
    ax.legend(loc = 'best')

# Call the function to create plot
overlaid_histogram(data1 = daily_data['registered']
                   , data1_name = 'Registered'
                   , data1_color = '#539caf'
                   , data2 = daily_data['casual']
                   , data2_name = 'Casual'
                   , data2_color = '#7663b0'
                   , x_label = 'Check outs'
                   , y_label = 'Frequency'
                   , title = 'Distribution of Check Outs By Type')
- registered:注册的分布,正态分布,why
- casual:偶然的分布,疑似指数分布,why
密度图
- 精细刻画概率分布
- KDE: kernal density estimate
# 计算概率密度
from scipy.stats import gaussian_kde
data = daily_data['registered']
density_est = gaussian_kde(data) # kernal density estimate: https://en.wikipedia.org/wiki/Kernel_density_estimation
# 控制平滑程度,数值越大,越平滑
density_est.covariance_factor = lambda : .3
density_est._compute_covariance()
x_data = np.arange(min(data), max(data), 200)

# 绘制密度估计曲线
def densityplot(x_data, density_est, x_label, y_label, title):
    _, ax = plt.subplots()
    ax.plot(x_data, density_est(x_data), color = '#539caf', lw = 2)
    ax.set_ylabel(y_label)
    ax.set_xlabel(x_label)
    ax.set_title(title)

# 调用绘图函数
densityplot(x_data = x_data
            , density_est = density_est
            , x_label = 'Check outs'
            , y_label = 'Frequency'
            , title = 'Distribution of Registered Check Outs')

type(density_est)
step5. 组间分析
- 组间定量比较
- 分组粒度
- 组间聚类
柱状图
- 一级类间均值方差比较
# 分天分析统计特征
mean_total_co_day = daily_data[['weekday', 'cnt']].groupby('weekday').agg([np.mean, np.std])
mean_total_co_day.columns = mean_total_co_day.columns.droplevel()

# 定义绘制柱状图的函数
def barplot(x_data, y_data, error_data, x_label, y_label, title):
    _, ax = plt.subplots()
    # 柱状图
    ax.bar(x_data, y_data, color = '#539caf', align = 'center')
    # 绘制方差
    # ls='none'去掉bar之间的连线
    ax.errorbar(x_data, y_data, yerr = error_data, color = '#297083', ls = 'none', lw = 5)
    ax.set_ylabel(y_label)
    ax.set_xlabel(x_label)
    ax.set_title(title)

# 绘图函数调用
barplot(x_data = mean_total_co_day.index.values
        , y_data = mean_total_co_day['mean']
        , error_data = mean_total_co_day['std']
        , x_label = 'Day of week'
        , y_label = 'Check outs'
        , title = 'Total Check Outs By Day of Week (0 = Sunday)')
mean_total_co_day.columns
daily_data[['weekday', 'cnt']].groupby('weekday').agg([np.mean, np.std])
堆积柱状图
- 多级类间相对占比比较
mean_by_reg_co_day = daily_data[['weekday', 'registered', 'casual']].groupby('weekday').mean()
mean_by_reg_co_day
# 分天统计注册和偶然使用的情况
mean_by_reg_co_day = daily_data[['weekday', 'registered', 'casual']].groupby('weekday').mean()
# 分天统计注册和偶然使用的占比
mean_by_reg_co_day['total'] = mean_by_reg_co_day['registered'] + mean_by_reg_co_day['casual']
mean_by_reg_co_day['reg_prop'] = mean_by_reg_co_day['registered'] / mean_by_reg_co_day['total']
mean_by_reg_co_day['casual_prop'] = mean_by_reg_co_day['casual'] / mean_by_reg_co_day['total']


# 绘制堆积柱状图
def stackedbarplot(x_data, y_data_list, y_data_names, colors, x_label, y_label, title):
    _, ax = plt.subplots()
    # 循环绘制堆积柱状图
    for i in range(0, len(y_data_list)):
        if i == 0:
            ax.bar(x_data, y_data_list[i], color = colors[i], align = 'center', label = y_data_names[i])
        else:
            # 采用堆积的方式,除了第一个分类,后面的分类都从前一个分类的柱状图接着画
            # 用归一化保证最终累积结果为1
            ax.bar(x_data, y_data_list[i], color = colors[i], bottom = y_data_list[i - 1], align = 'center', label = y_data_names[i])
    ax.set_ylabel(y_label)
    ax.set_xlabel(x_label)
    ax.set_title(title)
    ax.legend(loc = 'upper right') # 设定图例位置

# 调用绘图函数
stackedbarplot(x_data = mean_by_reg_co_day.index.values
               , y_data_list = [mean_by_reg_co_day['reg_prop'], mean_by_reg_co_day['casual_prop']]
               , y_data_names = ['Registered', 'Casual']
               , colors = ['#539caf', '#7663b0']
               , x_label = 'Day of week'
               , y_label = 'Proportion of check outs'
               , title = 'Check Outs By Registration Status and Day of Week (0 = Sunday)')
分组柱状图
- 多级类间绝对数值比较
# 绘制分组柱状图的函数
def groupedbarplot(x_data, y_data_list, y_data_names, colors, x_label, y_label, title):
    _, ax = plt.subplots()
    # 设置每一组柱状图的宽度
    total_width = 0.8
    # 设置每一个柱状图的宽度
    ind_width = total_width / len(y_data_list)
    # 计算每一个柱状图的中心偏移
    alteration = np.arange(-total_width/2+ind_width/2, total_width/2+ind_width/2, ind_width)

    # 分别绘制每一个柱状图
    for i in range(0, len(y_data_list)):
        # 横向散开绘制
        ax.bar(x_data + alteration[i], y_data_list[i], color = colors[i], label = y_data_names[i], width = ind_width)
    ax.set_ylabel(y_label)
    ax.set_xlabel(x_label)
    ax.set_title(title)
    ax.legend(loc = 'upper right')

# 调用绘图函数
groupedbarplot(x_data = mean_by_reg_co_day.index.values
               , y_data_list = [mean_by_reg_co_day['registered'], mean_by_reg_co_day['casual']]
               , y_data_names = ['Registered', 'Casual']
               , colors = ['#539caf', '#7663b0']
               , x_label = 'Day of week'
               , y_label = 'Check outs'
               , title = 'Check Outs By Registration Status and Day of Week (0 = Sunday)')
- 偏移前:ind_width/2
- 偏移后:total_width/2
- 偏移量:total_width/2-ind_width/2
箱式图
- 多级类间数据分布比较
- 柱状图 + 堆叠灰度图
# 只需要指定分类的依据,就能自动绘制箱式图
days = np.unique(daily_data['weekday'])
bp_data = []
for day in days:
    bp_data.append(daily_data[daily_data['weekday'] == day]['cnt'].values)

# 定义绘图函数
def boxplot(x_data, y_data, base_color, median_color, x_label, y_label, title):
    _, ax = plt.subplots()

    # 设置样式
    ax.boxplot(y_data
               # 箱子是否颜色填充
               , patch_artist = True
               # 中位数线颜色
               , medianprops = {'color': base_color}
               # 箱子颜色设置,color:边框颜色,facecolor:填充颜色
               , boxprops = {'color': base_color, 'facecolor': median_color}
               # 猫须颜色whisker
               , whiskerprops = {'color': median_color}
               # 猫须界限颜色whisker cap
               , capprops = {'color': base_color})

    # 箱图与x_data保持一致
    ax.set_xticklabels(x_data)
    ax.set_ylabel(y_label)
    ax.set_xlabel(x_label)
    ax.set_title(title)

# 调用绘图函数
boxplot(x_data = days
        , y_data = bp_data
        , base_color = 'b'
        , median_color = 'r'
        , x_label = 'Day of week'
        , y_label = 'Check outs'
        , title = 'Total Check Outs By Day of Week (0 = Sunday)')
7. 简单总结
- 关联分析、数值比较:散点图、曲线图
- 分布分析:灰度图、密度图
- 涉及分类的分析:柱状图、箱式图
8.案例:2014世界杯决赛分析
step1. 预处理
准备好相应的数据,同时也引入需要的包。
import pandas as pd
import numpy as np
import matplotlib.pyplot as plt

from footyscripts.footyviz import draw_events, draw_pitch, type_names

#plotting settings
%matplotlib inline
pd.options.display.mpl_style = 'default'
df = pd.read_csv("../datasets/germany-vs-argentina-731830.csv", encoding='utf-8', index_col=0)
df.head()

df.index = range(1,len(df) + 1)
df.head()
#standard dimensions
x_size = 105.0
y_size = 68.0
box_height = 16.5*2 + 7.32
box_width = 16.5
y_box_start = y_size/2-box_height/2
y_box_end = y_size/2+box_height/2

#scale of dataset is 100 by 100. Normalizing for a standard soccer pitch size
df['x']=df['x']/100*x_size
df['y']=df['y']/100*y_size
df['to_x']=df['to_x']/100*x_size
df['to_y']=df['to_y']/100*y_size

#creating some measures and classifiers from the original
df['count'] = 1
df['dx'] = df['to_x'] - df['x']
df['dy'] = df['to_y'] - df['y']
df['distance'] = np.sqrt(df['dx']**2+df['dy']**2)
df['fivemin'] = np.floor(df['min']/5)*5
df['type_name'] = df['type'].map(type_names.get)
df['to_box'] = (df['to_x'] > x_size - box_width) & (y_box_start < df['to_y']) & (df['to_y'] < y_box_end)
df['from_box'] = (df['x'] > x_size - box_width) & (y_box_start < df['y']) & (df['y'] < y_box_end)
df['on_offense'] = df['x']>x_size/2
添加队名和球员的名字,翻遍后面进行统计和评估
df['team_name'] = np.where(df['team']==357, 'Germany', 'Argentina')

player_dic = {15207:"Philipp Lahm",44989:"Toni Kroos",15208:"Bastian Schweinsteiger",40691:"Jerome Boateng",37605:"Mesut Özil",32644:"Javier Mascherano",66842:"André Schürrle",41316:"Benedikt Höwedes",38392:"Mats Hummels",55634:"Thomas Müller",39462:"Lucas Biglia",28525:"Ezequiel Garay",15312:"Martín Demichelis",20658:"Pablo Zabaleta",19054:"Lionel Messi",58893:"Marcos Rojo",20388:"Manuel Neuer",55661:"Enzo Pérez",42899:"Sergio Agüero",37572:"Sergio Romero",5155:"Miroslav Klose",69600:"Fernando Gago",19975:"Mario Götze",40232:"Gonzalo Higuaín",45154:"Ezequiel Lavezzi",20153:"Rodrigo Palacio",100927:"Christoph Kramer",17127:"Per Mertesacker"}

def get_player_name(player_id):
    return player_dic[player_id]

df['player_name'] = df['player_id'].apply(get_player_name)
#preslicing of the main DataFrame in smaller DFs that will be reused along the notebook
dfPeriod1 = df[df['period']==1]
dfP1Shots = dfPeriod1[dfPeriod1['type'].isin([13, 14, 15, 16])]
dfPeriod2 = df[df['period']==2]
dfP2Shots = dfPeriod2[dfPeriod2['type'].isin([13, 14, 15, 16])]
dfExtraTime = df[df['period']>2]
dfETShots = dfExtraTime[dfExtraTime['type'].isin([13, 14, 15, 16])]
step2. 上半场
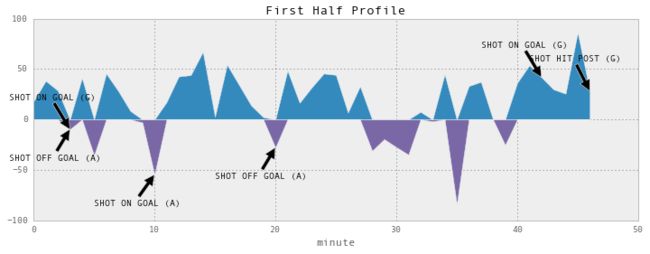
咱们快速过一下上半场,下面我们来做一个图标,看看进攻和防守的状况(大于0的上半部分表示德国队的进攻,小于0的部分表示德国队的防守),图中还标出了射球的点。
fig = plt.figure(figsize=(12,4))

avg_x = (dfPeriod1[dfPeriod1['team_name']=='Germany'].groupby('min').apply(np.mean)['x'] -
         dfPeriod1[dfPeriod1['team_name']=='Argentina'].groupby('min').apply(np.mean)['x'])

plt.stackplot(list(avg_x.index.values), list([x if x>0 else 0 for x in avg_x]))
plt.stackplot(list(avg_x.index.values), list([x if x<0 else 0 for x in avg_x]))

for i, shot in dfP1Shots.iterrows():
    x = shot['min']
    y = avg_x.ix[shot['min']]
    signal = 1 if shot['team_name']=='Germany' else -1
    plt.annotate(s=(shot['type_name']+' ('+shot['team_name'][0]+")"), xy=(x, y), xytext=(x-5,y+30*signal), arrowprops=dict(facecolor='black'))

plt.gca().set_xlabel('minute')
plt.title("First Half Profile")
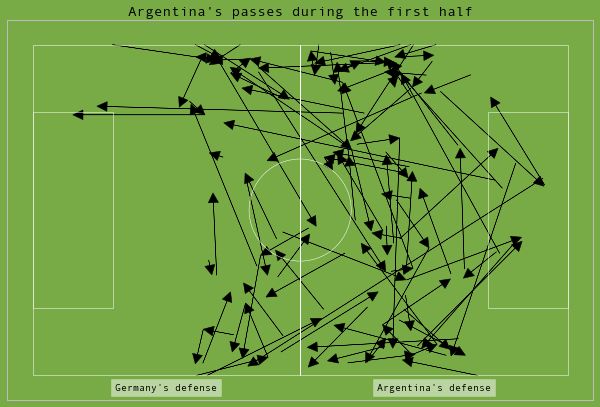
上半场很有意思的地方在于,德国队基本主导着比赛,使得阿根廷大多数时候都在自己的半场内传球。对于这个的一个可视化,可能更能说明问题,我们一起来看看,阿根廷上半场的传球路径。
draw_pitch()
draw_events(dfPeriod1[(dfPeriod1['type']==1) & (dfPeriod1['outcome']==1) & (dfPeriod1['team_name']=='Argentina')], mirror_away=True)
plt.text(x_size/4, -3, "Germany's defense", color='black', bbox=dict(facecolor='white', alpha=0.5), horizontalalignment='center')
plt.text(x_size*3/4, -3, "Argentina's defense", color='black', bbox=dict(facecolor='white', alpha=0.5), horizontalalignment='center')
plt.title("Argentina's passes during the first half")
dfPeriod1.groupby('team_name').agg({'x': np.mean, 'on_offense': np.mean})

dfPeriod1[dfPeriod1.type==1].groupby('team_name').agg({'outcome': np.mean})
上面还做了一个数据的分析,阿根廷大概只有28%的传球是在进攻阶段,而德国有61%是进攻阶段。同时即使是进攻阶段,你会发现德国队也保持着更高的传球准确率。
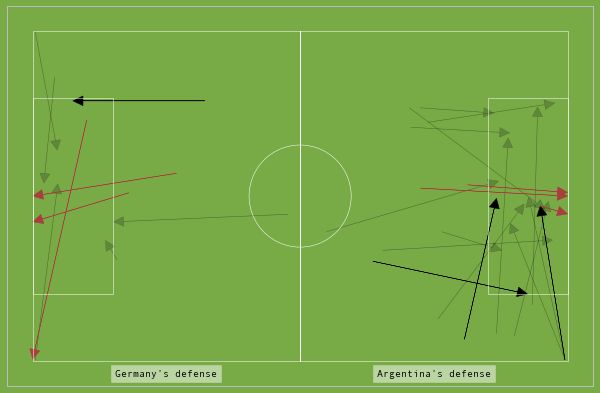
不过从进入禁区和射门的角度上看,德国队也并没有这么轻松,事实上,从下面我们做出的图里你可以看到,德国队在多次尝试进入禁区射门里,有效的很少。
draw_pitch()
draw_events(df[(df['to_box']==True) & (df['type']==1) & (df['from_box']==False) & (df['period']==1) & (df['outcome']==1)], mirror_away=True)
draw_events(df[(df['to_box']==True) & (df['type']==1) & (df['from_box']==False) & (df['period']==1) & (df['outcome']==0)], mirror_away=True, alpha=0.2)
draw_events(dfP1Shots, mirror_away=True, base_color='#a93e3e')
plt.text(x_size/4, -3, "Germany's defense", color='black', bbox=dict(facecolor='white', alpha=0.5), horizontalalignment='center')
plt.text(x_size*3/4, -3, "Argentina's defense", color='black', bbox=dict(facecolor='white', alpha=0.5), horizontalalignment='center')
dfPeriod1[(dfPeriod1['to_box']==True) & (dfPeriod1['from_box']==False) & (dfPeriod1['type']==1)].groupby(['team_name']).agg({'outcome': np.mean, 'count': np.sum})
step3. 关于克拉默的分析
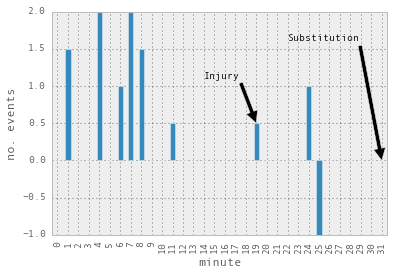
大概19分钟的时候,克拉默受伤了,但是12分钟之后才真正换上替补球员。然后你会发现这段时间简直就是德国上半场的地狱期,在我们之前的图表里也可以看出来。
Reports say that he acted confused,相关数据表明在克拉默受伤以后直到替补上场,他基本是“无功能”状态:唯一做的可能就是有一个接应,同时穿了一次球,还失掉了一次球。
dfKramer = df[df['player_name']=='Christoph Kramer']
pd.pivot_table(dfKramer, values='count', index='type_name', columns='min', aggfunc=sum, fill_value=0)

dfKramer['action']=dfKramer['outcome'].map(str) + '-' + dfKramer['type_name']
dfKramer['action'].unique()

score = {'1-LINEUP': 0, '1-RUN WITH BALL': 0.5, '1-RECEPTION': 0, '1-PASS': 1, '0-PASS': -1,
       '0-TACKLE (NO CONTROL)': 0, '1-CLEAR BALL (OUT OF PITCH)': 0.5,
       '0-LOST CONTROL OF BALL': -1, '1-SUBSTITUTION (OFF)': 0}

dfKramer['score'] = dfKramer['action'].map(score.get)
dfKramer.groupby('min')['score'].sum().reindex(range(32), fill_value=0).plot(kind='bar')
plt.annotate('Injury', (19,0.5), (14,1.1), arrowprops=dict(facecolor='black'))
plt.annotate('Substitution', (31,0), (22,1.6), arrowprops=dict(facecolor='black'))
plt.gca().set_xlabel('minute')
plt.gca().set_ylabel('no. events')
step4. 下半场
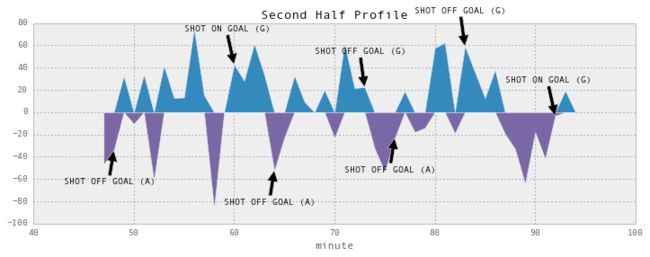
相比之下,下半场就势均力敌多了,按照上半场的方式绘出图形,你会发现双方的控球确实是相当的。
fig = plt.figure(figsize=(12,4))

avg_x = (dfPeriod2[dfPeriod2['team_name']=='Germany'].groupby('min').apply(np.mean)['x'] -
         dfPeriod2[dfPeriod2['team_name']=='Argentina'].groupby('min').apply(np.mean)['x'])

plt.stackplot(list(avg_x.index.values), list([x if x>0 else 0 for x in avg_x]))
plt.stackplot(list(avg_x.index.values), list([x if x<0 else 0 for x in avg_x]))

for i, shot in dfP2Shots.iterrows():
    x = shot['min']
    y = avg_x.ix[shot['min']]
    signal = 1 if shot['team_name']=='Germany' else -1
    plt.annotate(s=(shot['type_name']+' ('+shot['team_name'][0]+")"), xy=(x, y), xytext=(x-5,y+30*signal), arrowprops=dict(facecolor='black'))

plt.gca().set_xlabel('minute')
plt.title("Second Half Profile")
dfPeriod2.groupby('team_name').agg({'x': np.mean, 'on_offense': np.mean})

dfPeriod2[dfPeriod2['type']==1].groupby('team_name').agg({'outcome': np.mean})
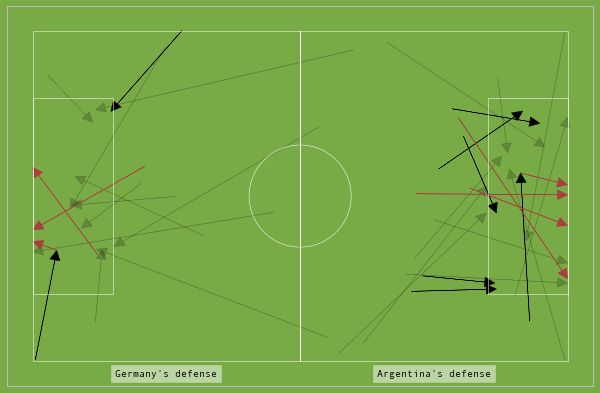
draw_pitch()
draw_events(df[(df['to_box']==True) & (df['type']==1) & (df['from_box']==False) & (df['period']==2) & (df['outcome']==1)], mirror_away=True)
draw_events(df[(df['to_box']==True) & (df['type']==1) & (df['from_box']==False) & (df['period']==2) & (df['outcome']==0)], mirror_away=True, alpha=0.2)
draw_events(dfP2Shots, mirror_away=True, base_color='#a93e3e')
plt.text(x_size/4, -3, "Germany's defense", color='black', bbox=dict(facecolor='white', alpha=0.5), horizontalalignment='center')
plt.text(x_size*3/4, -3, "Argentina's defense", color='black', bbox=dict(facecolor='white', alpha=0.5), horizontalalignment='center')
dfPeriod2[(dfPeriod2['to_box']==True) & (dfPeriod2['from_box']==False) & (dfPeriod2['type']==1)].groupby(['team_name']).agg({'outcome': np.mean, 'count': np.sum})
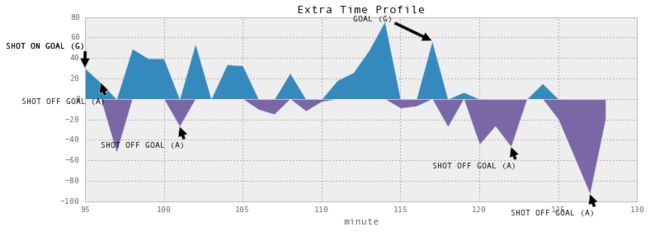
step5. 加时部分
fig = plt.figure(figsize=(12,4))

avg_x = (dfExtraTime[dfExtraTime['team_name']=='Germany'].groupby('min').apply(np.mean)['x'] -
         dfExtraTime[dfExtraTime['team_name']=='Argentina'].groupby('min').apply(np.mean)['x'].reindex(dfExtraTime['min'].unique(), fill_value=0))

plt.stackplot(list(avg_x.index.values), list([x if x>0 else 0 for x in avg_x]))
plt.stackplot(list(avg_x.index.values), list([x if x<0 else 0 for x in avg_x]))

for i, shot in dfETShots.iterrows():
    x = shot['min']
    y = avg_x.ix[shot['min']]
    signal = 1 if shot['team_name']=='Germany' else -1
    plt.annotate(s=(shot['type_name']+' ('+shot['team_name'][0]+")"), xy=(x, y), xytext=(x-5,y+20*signal), arrowprops=dict(facecolor='black'))

plt.gca().set_xlabel('minute')
plt.title("Extra Time Profile")
df.groupby(['team_name', 'period']).agg({'count': np.sum, 'x': np.mean, 'on_offense': np.mean})
我们发现德国队的第4段和其余阶段很不同,德国队明显减少了传球次数,他们在试图控制比赛,把节奏放慢(有点拖延时间的味道?)。你可以看看在德国队的上一记射门之后的数据,更能体现这一点。
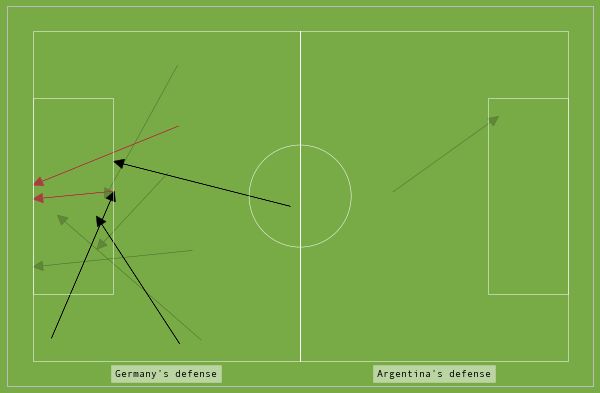
goal_ix = df[df['type']==16].index[0]
df_after_shot = df.ix[goal_ix+1:]
df_after_shot.groupby(['team_name', 'period']).agg({'count': np.sum, 'x': np.mean, 'on_offense': np.mean})
draw_pitch()
draw_events(df_after_shot[(df_after_shot['to_box']==True) & (df_after_shot['type']==1) & (df_after_shot['from_box']==False) & (df_after_shot['outcome']==1)], mirror_away=True)
draw_events(df_after_shot[(df_after_shot['to_box']==True) & (df_after_shot['type']==1) & (df_after_shot['from_box']==False) & (df_after_shot['outcome']==0)], mirror_away=True, alpha=0.2)
draw_events(df_after_shot[df_after_shot['type'].isin([13,14,15,16])], mirror_away=True, base_color='#a93e3e')
plt.text(x_size/4, -3, "Germany's defense", color='black', bbox=dict(facecolor='white', alpha=0.5), horizontalalignment='center')
plt.text(x_size*3/4, -3, "Argentina's defense", color='black', bbox=dict(facecolor='white', alpha=0.5), horizontalalignment='center')
df_after_shot[df_after_shot['type'].isin([13,14,15,16])][['min', 'player_name', 'team_name', 'type_name']]
德国队基本不打算继续射门了,只有一次是试图把球传入禁区的。但是他们的防守策略非常成功,以至于阿根廷基本很难进入他们的禁区。2记射门全都是禁区外射门的,而且都出自梅西之脚,然而梅西可能到这时候也深感绝望了。
step6. 射门
goal = int(df[df['type']==16].index[0])
dfGoal = df.ix[goal-30:goal]
#goal = np.where(df.type==16)[0][0]
#dfGoal = df.iloc[goal-30:goal+1]
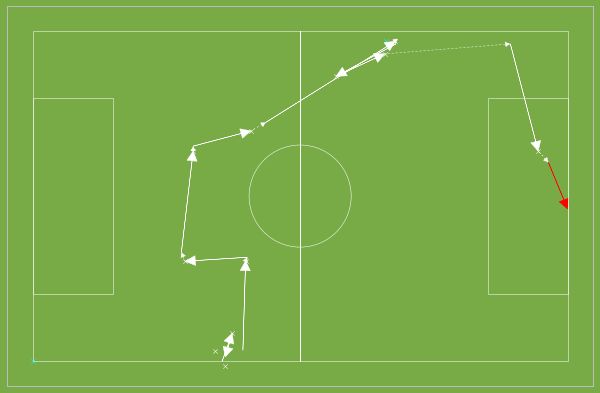
draw_pitch()
draw_events(dfGoal[dfGoal.team_name=='Germany'], base_color='white')
draw_events(dfGoal[dfGoal.team_name=='Argentina'], base_color='cyan')
#Germany's players involved in the play
dfGoal['progression']=dfGoal['to_x']-dfGoal['x']
dfGoal[dfGoal['type'].isin([1, 101, 16])][['player_name', 'type_name', 'progression']]
step7. 一些基础数据
#passing accuracy
df.groupby(['player_name', 'team_name']).agg({'count': np.sum, 'outcome': np.mean}).sort('count', ascending=False)

#shots
pd.pivot_table(df[df['type'].isin([13,14,15,16])],
               values='count',
               aggfunc=sum,
               index=['player_name', 'team_name'],
               columns='type_name',
               fill_value=0,
               margins=True).sort('All', ascending=False)

#defensive play
pd.pivot_table(df[df['type'].isin([7, 8, 49])],
               values='count',
               aggfunc=np.sum,
               index=['player_name', 'team_name'],
               columns='type_name',
               fill_value=0,
               margins=True).sort('All', ascending=False)
