使用ggplot画分页图
- 需求
- 数据
- facet_wrap
- facet_wrap参数说明
需求
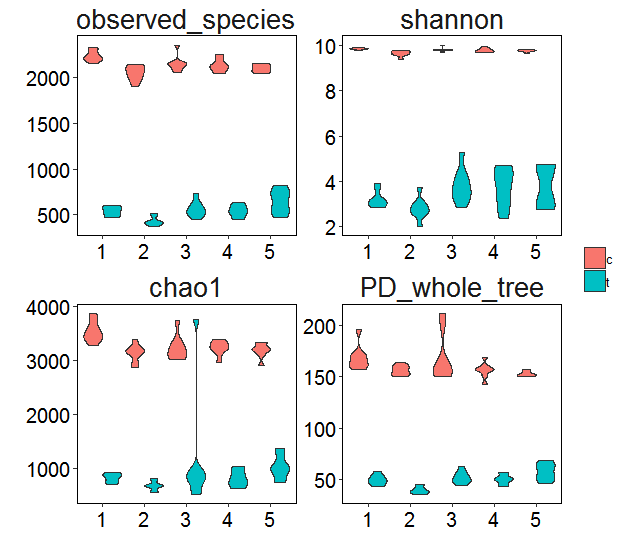
由于有较多组的样品需要比较,图片皆为小提琴图,因此需要将多个样品的小提琴图放在一张图上面比较,比如下图:
备注:部分参考 R语言绘制箱线图和小提琴图作图示例的内容。
数据
这里用于画图的数据皆来自科学网lyao222lll的个人博客,这里画分页图主要用的数据为alpha1,数据结构如下:
> head(alpha1)
  samples group1 group2         variable value
1    c1.1      c      1 observed_species  2323
2    c1.2      c      1 observed_species  2203
3    c1.3      c      1 observed_species  2156
4    c1.4      c      1 observed_species  2324
5    c1.5      c      1 observed_species  2203
6    c1.6      c      1 observed_species  2207
facet_wrap分页画图
#首先对x轴、y轴等相关ggplot画图的参加进行设置
p0<-theme(axis.text.x = element_text(color="black",size=15),
        axis.text.y = element_text(color="black",size=15),
        axis.title.x = element_text(face="plain", color="black",size=20),
        axis.title.y = element_text(face="plain", color="black",size=20),
        title=element_text(size=20))
#ggplot画图
ggplot(alpha1, aes(x = group2, y = value, fill = group1)) +
geom_violin(scale = "width",adjust =1) +
facet_wrap(~variable, nrow =2,ncol =4,scales = 'free_x') +
labs(x = '', y = '') +
theme(panel.grid = element_blank(), panel.background = element_rect(fill = 'transparent', color = 'black'), legend.title = element_blank(), legend.key = element_blank(),strip.text = element_text(size = 20),strip.background = element_rect(fill = NA, colour = NA),strip.text.y = element_blank())+p0
facet_wrap参数说明
参数说明:
facet_wrap(facets, nrow = NULL, ncol = NULL, scales = "fixed",
shrink = TRUE, labeller = "label_value", as.table = TRUE,
switch = NULL, drop = TRUE, dir = "h", strip.position = "top")
这里使用数据框“alpha1”作为作图数据,该数据框中包含了所有样本(分组)的所有类型的alpha多样性指数信息。以其中的group2列中的因子为横坐标,value列中的数值为纵坐标,使用geom_boxplot()绘制箱线图,并按两大分组(示例数据中的c组和t组)着色。使用facet_wrap()在ggplot2中添加分面,依据alpha多样性指数类型种类数(本示例为4种)分别作图展示各alpha多样性指数在各分组中的分布情况。theme()简要设置主题,包括去除默认的背景框、图例标题和背景色等。其它更多细节参数未加以设置,大家若有需要可自行调整(参考R语言绘制箱线图和小提琴图作图示例的内容)。
这里主要介绍一下对每一副图中标题、坐标的调整,x和y轴坐标调整与其他ggplot画图一样,可以通过theme()函数调整,比如这里的p0:
p0<-theme(panel.grid=element_blank(), legend.background = element_rect(colour = NA),
        legend.title = element_blank(),legend.text = element_text(face="plain", color="black",size = 20),
        legend.position = 'none',
        axis.text.x = element_text(color="black",size=15),
        axis.text.y = element_text(color="black",size=15),
        axis.title.x = element_text(face="plain", color="black",size=20),
        axis.title.y = element_text(face="plain", color="black",size=20))
另外就是对一副图中的标题名称的调整,这里也是通过theme()函数调整调整,区别是这里主要通过strip函数调整,比如如下命令:
theme(panel.grid = element_blank(), panel.background = element_rect(fill = 'transparent', color = 'black'), legend.title = element_blank(), legend.key = element_blank(),strip.text = element_text(size = 20),strip.background = element_rect(fill = NA, colour = NA),strip.text.y = element_blank())
strip.text:主要调整标题大小或者颜色。
strip.background:标题的背景颜色,可以选择颜色或者调整边框颜色。
strip.text.y或者strip.text.x:调整x轴或者y轴标题。示范画图只有x轴,因此如果设置为element_blank(),将不显示标题。
scales :是分页画图中非常重要的一个命令,如果是scales = 'free',则表明每一副图将根据各自的数据调整图的内容,但是如果这样的话,各个图的坐标轴将不一样,如果想要将各个图的坐标设置一样,将不能设置free,该参数可以对某个坐标轴进行设定,其值可以等于 'free_x'和'free_x'。
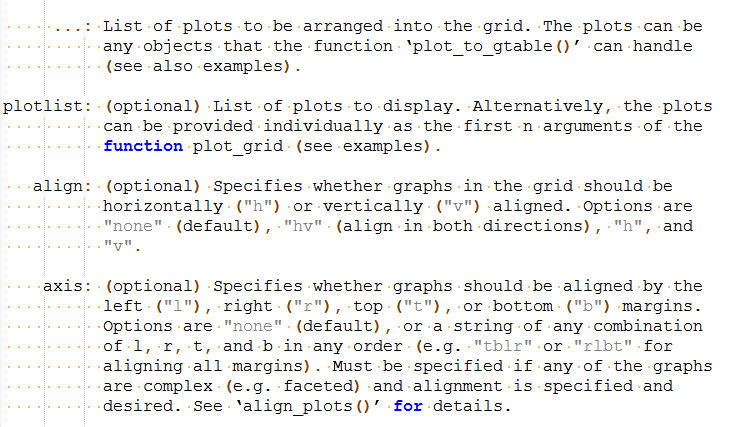
上面介绍的所有数据都在一个矩阵中画分页图,但是如果数据不能在一个矩阵,该如何呢?可以看看plot_grid函数,plot_grid(p1, p2,p3, labels = c("A", "B", "C"), ncol = 2, nrow = 2).
require(cowplot)
  plot_grid(..., plotlist = NULL, align = c("none", "h", "v", "hv"),
       axis = c("none", "l", "r", "t", "b", "lr", "tb", "tblr"),
       nrow = NULL, ncol = NULL, rel_widths = 1, rel_heights = 1,
       labels = NULL, label_size = 14, label_fontfamily = NULL,
       label_fontface = "bold", label_colour = NULL, label_x = 0,
       label_y = 1, hjust = -0.5, vjust = 1.5, scale = 1, cols = NULL,
       rows = NULL)
参考文档
参考博客:ggplot2画分面图
官方参数说明:Wrap a 1d ribbon of panels into 2d
facet_wrap分页画图一些参数微调说明
plot_grid简单的说明示范


