教程对应B站:【生信技能树】生信人应该这样学R语言
配套资料:B站的11套生物信息学公益视频配套讲义、练习题及思维导图
先仔细观看视频,理解代码含义
题目
链接:http://www.bio-info-trainee.com/3409.html
- 安装包
- 数据处理
- 数据分析
- 差异分析
也可以左侧目录栏,效果如下,上有程序作者写的教程,我觉得很方便,推荐给大家。
安装包
1、安装一些R包:
数据包:ALL, CLL, pasilla, airway
软件包:limma,DESeq2,clusterProfiler
工具包:reshape2
绘图包:ggplot2
不同领域的R包使用频率不一样,在生物信息学领域,尤其需要掌握bioconductor系列包。
对应视频教程:https://www.bilibili.com/video/av25643438/?p=22
菜鸟团文字教程:http://www.bio-info-trainee.com/1565.html
library()函数检查包是否可运行
数据处理
提取表达矩阵
2、了解ExpressionSet对象,比如CLL包里面就有data(sCLLex) ,找到它包含的元素,提取其表达矩阵(使用exprs函数),查看其大小
3、了解 str,head,help函数,作用于 第二步提取到的表达矩阵
参考:http://www.bio-info-trainee.com/bioconductor_China/software/limma.html
参考:https://github.com/bioconductor-china/basic/blob/master/ExpressionSet.md
suppressPackageStartupMessages(library(CLL))
data("sCLLex")
# 获得表达矩阵
exprSet = exprs(sCLLex)
str(exprSet) # structure
head(exprSet) # 前六行
dim(exprSet) # 包含了12625个探针,22个样本
sampleNames(sCLLex) # 查看样本编号
varMetadata(sCLLex) # 查看标签描述(表型变量)

pd = pData(sCLLex) # 查看样本分组情况
Disease = pd[,2]
table(Disease)
## Disease
## progres.   stable
##       14        8
了解hgu95av2.db包
4、安装并了解hgu95av2.db包,看看 ls("package:hgu95av2.db") 后显示的哪些变量?
链接:http://www.bio-info-trainee.com/tag/hgu95av2-db
hgu95av2.db是一个关于 hgu95av2 芯片的注释包
suppressPackageStartupMessages(library(hgu95av2.db))
ls("package:hgu95av2.db")
##  [1] "hgu95av2"              "hgu95av2_dbconn"
##  [3] "hgu95av2_dbfile"       "hgu95av2_dbInfo"
##  [5] "hgu95av2_dbschema"     "hgu95av2.db"
##  [7] "hgu95av2ACCNUM"        "hgu95av2ALIAS2PROBE"
##  [9] "hgu95av2CHR"           "hgu95av2CHRLENGTHS"
## [11] "hgu95av2CHRLOC"        "hgu95av2CHRLOCEND"
## [13] "hgu95av2ENSEMBL"       "hgu95av2ENSEMBL2PROBE"
## [15] "hgu95av2ENTREZID"      "hgu95av2ENZYME"
## [17] "hgu95av2ENZYME2PROBE"  "hgu95av2GENENAME"
## [19] "hgu95av2GO"            "hgu95av2GO2ALLPROBES"
## [21] "hgu95av2GO2PROBE"      "hgu95av2MAP"
## [23] "hgu95av2MAPCOUNTS"     "hgu95av2OMIM"
## [25] "hgu95av2ORGANISM"      "hgu95av2ORGPKG"
## [27] "hgu95av2PATH"          "hgu95av2PATH2PROBE"
## [29] "hgu95av2PFAM"          "hgu95av2PMID"
## [31] "hgu95av2PMID2PROBE"    "hgu95av2PROSITE"
## [33] "hgu95av2REFSEQ"        "hgu95av2SYMBOL"
## [35] "hgu95av2UNIGENE"       "hgu95av2UNIPROT"
as.list(hgu95av2ENZYME[1])  # key为探针号,value为酶
## $`1000_at`
## [1] "2.7.11.24"
get(featureNames(sCLLex),hgu95av2ENZYME, mode="any", inherits=TRUE)
## [1] "2.7.11.24"
# get()、mget()都可以取
5、理解head(toTable(hgu95av2SYMBOL))的用法,找到TP53基因对应的探针ID。
ids <- toTable(hgu95av2SYMBOL)
# 两种写法
ids[which(ids[,2]=="TP53"),]
ids[grep("^TP53$",ids$symbol),]
##       probe_id symbol
## 966    1939_at   TP53
## 997  1974_s_at   TP53
## 1420  31618_at   TP53
探针与基因的关系
6、理解探针与基因的对应关系,总共多少个基因,基因最多对应多少个探针,是哪些基因,是不是因为这些基因很长,所以在其上面设计多个探针呢?
class(hgu95av2SYMBOL)
## [1] "ProbeAnnDbBimap"
## attr(,"package")
## [1] "AnnotationDbi"

# hgu95av2SYMBOL is the Bimap Objects
# 2 sets of objects: the left objects and the right objects.
# 详解:https://www.rdocumentation.org/packages/AnnotationDbi/versions/1.34.4/topics/Bimap
summary(hgu95av2SYMBOL)
# 探针ID总数为12625,能匹配上的为11460;基因总数为61050,实际为8585

mapped_probes <- mappedkeys(hgu95av2SYMBOL)
count.mappedkeys(hgu95av2SYMBOL)
## [1] 11460
ids <- toTable(hgu95av2SYMBOL)
colnames(ids)
## [1] "probe_id" "symbol"
# %>% 使用管道操作函数依次将左侧独享作为参数传入右侧函数内部,层层传递,不创建任何中间变量
suppressPackageStartupMessages(library(stringr))
unique(ids$symbol) %>% length()  # unique() 避免重复基因
## [1] 8585

table(ids$symbol) %>% sort() %>% tail() # 基因最多对应8个探针
##
## YME1L1  GAPDH INPP4A    MYB PTGER3  STAT1
##      7      8      8      8      8      8

table(ids$symbol) %>% table() # 最多有6555个基因对应一个探针
## .
##    1    2    3    4    5    6    7    8
## 6555 1428  451  102   22   16    6    5
7、第二步提取到的表达矩阵是12625个探针在22个样本的表达量矩阵,找到那些不在 hgu95av2.db 包收录的对应着SYMBOL的探针。
提示:有1165个探针是没有对应基因名字的。
# %in% is_in
'%!in%' <- function(x,y)!('%in%'(x,y))
# Lkeys() 得到 left objects 的值
length(Lkeys(hgu95av2SYMBOL)[Rkeys(hgu95av2SYMBOL) %!in% mapped_probes])
# 得到1165个未匹配上的探针ID
8、过滤表达矩阵,删除那1165个没有对应基因名字的探针。
table(rownames(exprSet) %in% mapped_probes)
##
## FALSE  TRUE
##  1165 11460

e = exprSet[rownames(exprSet) %in% mapped_probes,]
str(exprSet) # 12625
str(e) # 11460
# e为删除后的表达矩阵
整合表达矩阵
9、整合表达矩阵,多个探针对应一个基因的情况下,只保留在所有样本里面平均表达量最大的那个探针。
提示,理解 tapply,by,aggregate,split 函数 , 首先对每个基因找到最大表达量的探针,然后根据得到探针去过滤原始表达矩阵。
# by(data, INDICES, FUN, ..., simplify = TRUE)
# 举例帮助理解函数,这是整合后的,可拆解理解
rownames(e[4:5,])[which.max(rowMeans(e[4:5,]))]
## [1] "1004_at"
# 数据框用by,向量用tapply
maxid = by(e,ids$symbol,function(x) rownames(x)[which.max(rowMeans(x))])
# aggregate 将数据按行分组,对每一组数据进行函数统计

uniid = as.character(maxid)
uni_e = e[rownames(e) %in% uniid,]
str(uni_e)  # 8585
10、把过滤后的表达矩阵更改行名为基因的symbol,因为这个时候探针和基因是一对一关系了。
rownames(uni_e) = ids[match(rownames(uni_e),ids$probe_id),2]
suppressPackageStartupMessages(library(reshape2))
# match exprSet
m_e = melt(uni_e)
colnames(m_e) = c('symbol','sample','value')
m_e$group = rep(Disease,each=nrow(uni_e))
数据分析
基因数据分析
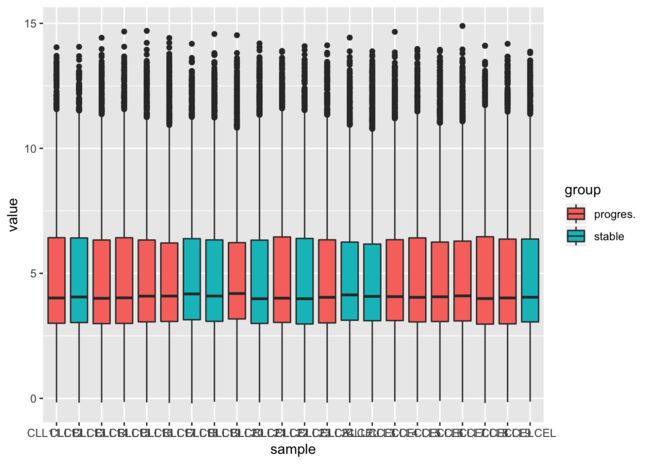
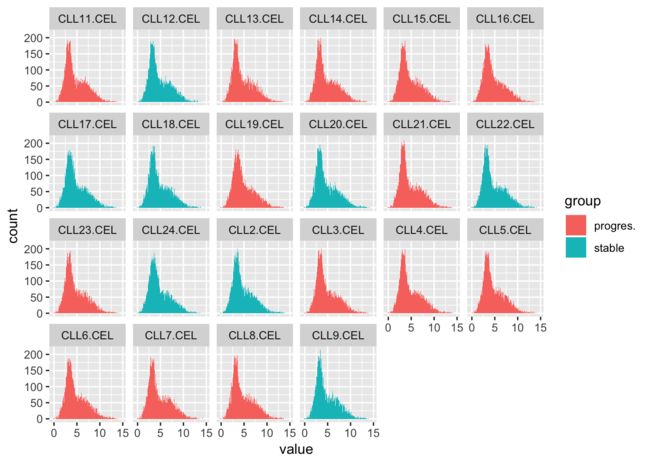
11、对第10步得到的表达矩阵进行探索,先画第一个样本的所有基因的表达量的boxplot,hist,density,然后画所有样本的这些图
参考:http://bio-info-trainee.com/tmp/basic_visualization_for_expression_matrix.html 理解ggplot2的绘图语法,数据和图形元素的映射关系
suppressPackageStartupMessages(library(ggplot2))
ggplot(m_e,aes(x=sample,y=value,fill=group)) + geom_boxplot()
ggplot(m_e,aes(value,fill=group)) + geom_histogram(bins = 200)+facet_wrap(~sample, nrow = 4)
ggplot(m_e,aes(value,col=group)) + geom_density()
12、理解统计学指标mean,median,max,min,sd,var,mad并计算出每个基因在所有样本的这些统计学指标,最后按照mad值排序,取top 50 mad值的基因,得到列表。
注意:这个题目出的并不合规,请仔细看。
# 平均值、中位数、最大值、最小值、标准差、变量、中位数绝对偏差
e_mean = tail(sort(apply(uni_e,1,mean)),50)
e_median = tail(sort(apply(uni_e,1,median)),50)
e_max = tail(sort(apply(uni_e,1,max)),50)
e_min = tail(sort(apply(uni_e,1,min)),50)
e_sd = tail(sort(apply(uni_e,1,sd)),50)
e_var = tail(sort(apply(uni_e,1,var)),50)
e_mad = tail(sort(apply(uni_e,1,mad)),50)
13、根据第12步骤得到top 50 mad值的基因列表来取表达矩阵的子集,并且热图可视化子表达矩阵。试试看其它5种热图的包的不同效果。
# 做热图之前需要将数据中心化、标准化
top50_gene = tail(sort(apply(uni_e,1,mad)),50)
top50_matrix = uni_e[top50_gene,]
top50_matrix2 = t(scale(t(top50_matrix))) # scale() 对数据进行标准化
# 标准化是原始分数减去平均数然后除以标准差,中心化是原始分数减去平均数。一般流程为先中心化再标准化
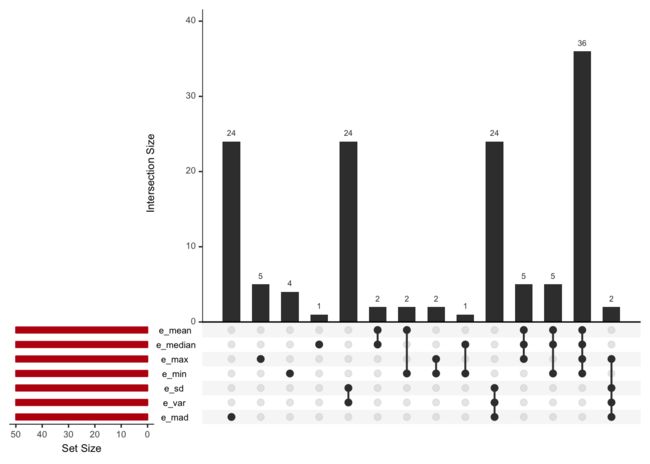
14、取不同统计学指标mean,median,max,mean,sd,var,mad的各top50基因列表,使用UpSetR包来看他们之间的overlap情况。
suppressPackageStartupMessages(library("UpSetR"))
all = c(names(e_mean),names(e_median),names(e_max),names(e_min),names(e_sd),names(e_var),names(e_mad)) %>% unique()
e_all = data.frame(all,
                   e_mean=ifelse(all %in% names(e_mean),1,0),
                   e_median=ifelse(all %in% names(e_median),1,0),
                   e_max=ifelse(all %in% names(e_max),1,0),
                   e_min=ifelse(all %in% names(e_min),1,0),
                   e_sd=ifelse(all %in% names(e_sd),1,0),
                   e_var=ifelse(all %in% names(e_var),1,0),
                   e_mad=ifelse(all %in% names(e_mad),1,0)
                   )
upset(e_all,nsets = 7,sets.bar.color = "#BD1111")
样本数据分析
15、在第二步的基础上面提取CLL包里面的data(sCLLex) 数据对象的样本的表型数据。
pd = pData(sCLLex)
group_list = as.character(pd[,2])
table(group_list)
## group_list
## progres.   stable
##       14        8
16、对所有样本的表达矩阵进行聚类并且绘图,然后添加样本的临床表型数据信息(更改样本名)
clust = t(exprSet)
rownames(clust) = colnames(exprSet)
clust_dist = dist(clust,method = "euclidean")
hc = hclust(clust_dist,"ward.D")
suppressPackageStartupMessages(library(factoextra))
fviz_dend(hc, k = 4 ,cex = 0.5,k_colors = c("#2E9FDF", "#00AFBB", "#E7B800", "#FC4E07"),
          color_labels_by_k = TRUE, rect = TRUE)
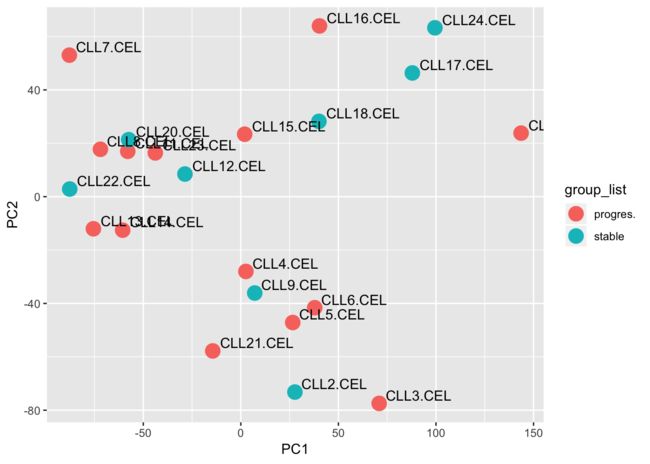
17、对所有样本的表达矩阵进行PCA分析并且绘图,同样要添加表型信息。
pca_data <- prcomp(t(exprSet),scale=TRUE)
pcx <- data.frame(pca_data$x)
pcr <- cbind(samples=rownames(pcx),group_list, pcx)
ggplot(pcr, aes(PC1, PC2))+geom_point(size=5, aes(color=group_list)) +
  geom_text(aes(label=samples),hjust=-0.1, vjust=-0.3)
18、根据表达矩阵及样本分组信息进行批量T检验,得到检验结果表格
gl = as.factor(group_list)
group1 = which(group_list == levels(gl)[1])
group2 = which(group_list == levels(gl)[2])
et1 = e[,group1]
et2 = e[,group2]
data_t = cbind(et1,et2)
pvals = apply(e, 1, function(x){
  t.test(as.numeric(x)~group_list)$p.value
})
p.adj = p.adjust(pvals, method = "BH")
data_mean_1 = rowMeans(et1)
#progres是对照组
data_mean_2 = rowMeans(et2)
#stable是使用药物处理后的——处理组
log2FC = data_mean_2-data_mean_1
DEG_t.test = cbind(data_mean_1, data_mean_2, log2FC, pvals, p.adj)
DEG_t.test=DEG_t.test[order(DEG_t.test[,4]),] #从小到大排序
DEG_t.test=as.data.frame(DEG_t.test)
head(DEG_t.test)
##          data_mean_1 data_mean_2     log2FC        pvals     p.adj
## 36129_at    7.875615    8.791753  0.9161377 1.629755e-05 0.1867699
## 37676_at    6.622749    7.965007  1.3422581 4.058944e-05 0.2211373
## 33791_at    7.616197    5.786041 -1.8301554 6.965416e-05 0.2211373
## 39967_at    4.456446    2.152471 -2.3039752 8.993339e-05 0.2211373
## 34594_at    5.988866    7.058738  1.0698718 9.648226e-05 0.2211373
## 32198_at    4.157971    3.407405 -0.7505660 2.454557e-04 0.3192169
差异分析
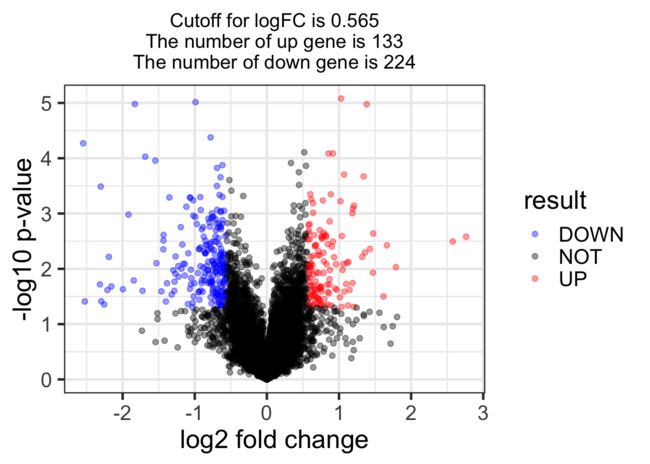
19、使用limma包对表达矩阵及样本分组信息进行差异分析,得到差异分析表格,重点看logFC和P值,画个火山图(就是logFC和-log10(P值)的散点图。)。
suppressPackageStartupMessages(library(limma))
design1=model.matrix(~factor(group_list))
colnames(design1)=levels(factor(group_list))
rownames(design1)=colnames(exprSet)
fit1 = lmFit(exprSet,design1)
fit1=eBayes(fit1)
options(digits = 3)
mtx1 = topTable(fit1,coef=2,adjust='BH',n=Inf)
# topTable 默认显示前10个基因的统计数据;使用选项n可以设置,n=Inf就是不设上限,全部输出
DEG_mtx1 = na.omit(mtx1) #去除缺失值
head(DEG_mtx1)
##           logFC AveExpr     t  P.Value adj.P.Val    B
## 39400_at  1.028    5.62  5.84 8.34e-06    0.0334 3.23
## 36131_at -0.989    9.95 -5.77 9.67e-06    0.0334 3.12
## 33791_at -1.830    6.95 -5.74 1.05e-05    0.0334 3.05
## 1303_at   1.384    4.46  5.73 1.06e-05    0.0334 3.04
## 36122_at -0.780    7.26 -5.14 4.21e-05    0.1062 1.93
## 36939_at -2.547    6.92 -5.04 5.36e-05    0.1128 1.74
DEG=DEG_mtx1
logFC_cutoff <- with(DEG,mean(abs(logFC)) + 2*sd(abs(logFC)) )
DEG$result = as.factor(ifelse(DEG$P.Value < 0.05 & abs(DEG$logFC) > logFC_cutoff,
                              ifelse(DEG$logFC > logFC_cutoff ,'UP','DOWN'),'NOT'))
this_tile <- paste0('Cutoff for logFC is ',round(logFC_cutoff,3), #round保留小数位数
                    '\nThe number of up gene is ',nrow(DEG[DEG$result =='UP',]) ,
                    '\nThe number of down gene is ',nrow(DEG[DEG$result =='DOWN',])
)
ggplot(data=DEG, aes(x=logFC, y=-log10(P.Value), color=result)) +
  geom_point(alpha=0.4, size=1.75) +
  theme_set(theme_set(theme_bw(base_size=20)))+
  xlab("log2 fold change") + ylab("-log10 p-value") +
  ggtitle( this_tile ) + theme(plot.title = element_text(size=15,hjust = 0.5))+
  scale_colour_manual(values = c('blue','black','red'))
20、对T检验结果的P值和limma包差异分析的P值画散点图,看看哪些基因相差很大?
DEG_t.test = DEG_t.test[rownames(DEG_mtx1),]
plot(DEG_t.test[,3],DEG_mtx1[,1])
plot(DEG_t.test[,4],DEG_mtx1[,4])
plot(-log10(DEG_t.test[,4]),-log10(DEG_mtx1[,4]))
更多学习资源:
生信技能树公益视频合辑
生信技能树账号
生信工程师入门最佳指南
生信技能树全球公益巡讲
招学徒
...
你的宣传能让数以万计的初学者找到他们的家,技能树平台一定不会辜负每一个热爱学习和分享的同道中人
