- grid 和 title.left(bottom,right,top)关系

image.png
//设置
title: {
  left: 'center' //将标题居中,数据类型为number或string
},
grid: {
  show: true //显示边框线
}
- legend(图列)

image.png
***

//设置
legend: {
  data: ['直接访问', '邮件营销', '联盟广告', '视频广告', '搜索引擎']
},
series: {
data: [
     {
       value: 335,
       name: '直接访问'
     },
     {
       value: 310,
       name: '邮件营销'
     },
     {
      value: 234,
      name: '联盟广告'
     },
     {
      value: 135,
      name: '视频广告'
     },
     {
      value: 1548,
      name: '搜索引擎'
     }
]}
滚动图例(点击三角形图标跳到对应页面)
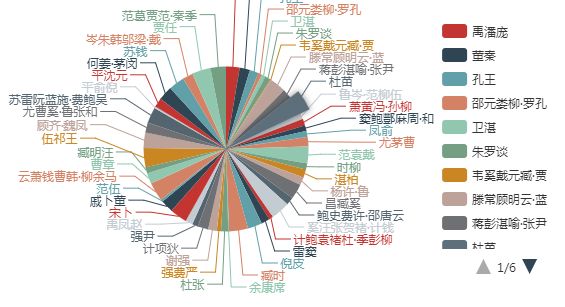
image.png
 //以下2种调用方法可以设置跳到哪个元素
        myChart.dispatchAction({
            type: 'legendScroll',
            scrollDataIndex: 26,
            // legendId: ''
        })
-------------------------------------------------
       legend: {
               scrollDataIndex: number,//
                   跳到索引对应的数据上,
                       但官网不推荐这种做法,说太重量了
           }
//配置
legend: {
    type: 'scroll',
    orient: 'vertical',
    right: 10,
    top: 20,
    bottom: 20,
    data: data.legendData,
    scrollDataIndex: number,//跳到索引对应的数据上,但官网不推荐这种做法,说太重量了
},
series: [{
    name: '姓名',
     type: 'pie',
    radius: '55%',
    center: ['40%', '50%'],
    data: data.seriesData,
    itemStyle: {
           emphasis: {
           shadowBlur: 10,
           shadowOffsetX: 0,
           shadowColor: 'rgba(0, 0, 0, 0.5)'
          }
     }
}]


function genData(count) {
            var nameList = [
                '赵', '钱', '孙', '李', '周', '吴', '郑', '王', '冯', '陈', '褚', '卫', '蒋', '沈', '韩', '杨', '朱', '秦', '尤', '许', '何', '吕', '施', '张', '孔', '曹', '严', '华', '金', '魏', '陶', '姜', '戚', '谢', '邹', '喻', '柏', '水', '窦', '章', '云', '苏', '潘', '葛', '奚', '范', '彭', '郎', '鲁', '韦', '昌', '马', '苗', '凤', '花', '方', '俞', '任', '袁', '柳', '酆', '鲍', '史', '唐', '费', '廉', '岑', '薛', '雷', '贺', '倪', '汤', '滕', '殷', '罗', '毕', '郝', '邬', '安', '常', '乐', '于', '时', '傅', '皮', '卞', '齐', '康', '伍', '余', '元', '卜', '顾', '孟', '平', '黄', '和', '穆', '萧', '尹', '姚', '邵', '湛', '汪', '祁', '毛', '禹', '狄', '米', '贝', '明', '臧', '计', '伏', '成', '戴', '谈', '宋', '茅', '庞', '熊', '纪', '舒', '屈', '项', '祝', '董', '梁', '杜', '阮', '蓝', '闵', '席', '季', '麻', '强', '贾', '路', '娄', '危'
            ];
            var legendData = [];
            var seriesData = [];
            for (var i = 0; i < 50; i++) {
                name = Math.random() > 0.65 ?
                    makeWord(4, 1) + '·' + makeWord(3, 0) :
                    makeWord(2, 1);
                legendData.push(name);
                seriesData.push({
                    name: name,
                    value: Math.round(Math.random() * 100000)
                });
            }

            return {
                legendData: legendData,
                seriesData: seriesData
            };

            function makeWord(max, min) {
                var nameLen = Math.ceil(Math.random() * max + min);
                var name = [];
                for (var i = 0; i < nameLen; i++) {
                    name.push(nameList[Math.round(Math.random() * nameList.length - 1)]);
                }
                return name.join('');
            }
        }
- axisPointer 中的label和lineStyle用法.
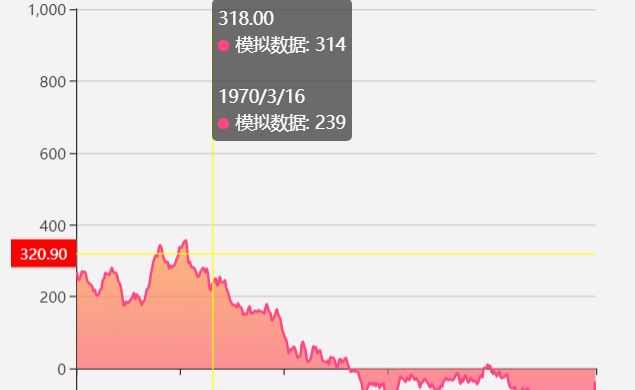
image.png
//配置
axisPointer: {
        show: true,//这个一定要为true,显示出来
        type: 'line',
        label: {

            textStyle: {
              backgroundColor: 'red',//指示器的颜色。

            }
        },
        lineStyle: {
          color    : 'yellow'//指示器线的颜色.
        }
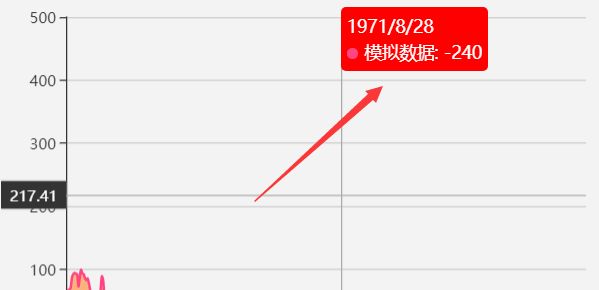
image.png
    tooltip: {
        trigger: 'axis',
        position: function (pt) {
            return [pt[0], '10%'];
        },
      // 通过css来控制浮层的外观
        extraCssText: 'background-color: red'
    },
function randomData() {
now = new Date(+now + oneDay);
value = value + Math.random() * 21 - 10;
return {
name: now.toString(),
value: [
[now.getFullYear(), now.getMonth() + 1, now.getDate()].join('-'),
Math.round(value)
]
}
}
var now = +new Date(2017, 7, 1);
var oneDay = 24 * 3600 * 1000;
var value = Math.random() * 1000;
- 多图联动 和 详细配置参数 demo
var option1 = {
calculable: true,
dataZoom: [{
type: 'slider',
start: 10,//控制滚轴的起始点
end: 40,//控制滚轴的结束点
height: 10,//控制滚轴的高度
bottom: 4,//控制滚轴的距离
handleIcon: 'M10.7,11.9v-1.3H9.3v1.3c-4.9,0.3-8.8,4.4-8.8,9.4c0,5,3.9,9.1,8.8,9.4v1.3h1.3v-1.3c4.9-0.3,8.8-4.4,8.8-9.4C19.5,16.3,15.6,12.2,10.7,11.9z M13.3,24.4H6.7V23h6.6V24.4z M13.3,19.6H6.7v-1.4h6.6V19.6z',//控制滚轴2边icon的形状
handleSize: '50%',//控制2边icon的大小
dataBackground: {
areaStyle: {
color: 'transparent'//控制滚轴内部颜色
},
lineStyle: {
opacity: 0.8,
color: 'transparent'//控制滚轴内线的颜色
}
},
handleStyle: {
color: 'red',//控制滚轴2边icon的颜色
shadowBlur: 3,
shadowColor: 'rgba(0, 0, 0, 0.6)',
shadowOffsetX: 2,
shadowOffsetY: 2
}
}, {
type: 'inside'
}],
textStyle: {
textShadowOffsetX: 5
},
title: {
show: true,//是否显示标题.
text: '每日客流达成量 单位: 百/人次',//标题内容
textStyle: {//标题的样式的相关设置
fontSize: 14,
fontFamily: 'MicrosoftYaHei',
fontWeight: "lighter",
color: '#808080'
},
left: 101,//标题的位置
top: 18,
padding: 8,
borderColor: '#58a',
borderWidth: 3
},
legend: {//图例
// orient: 'vertical'
itemGap: 10 //2个图例之中的距离
},
tooltip: {
show: true,
trigger: 'item', // 触发类型,默认数据触发,见下图,可选为:'item' ¦ 'axis'
showDelay: 20, // 显示延迟,添加显示延迟可以避免频繁切换,单位ms
hideDelay: 100, // 隐藏延迟,单位ms
transitionDuration: 0.4, // 动画变换时间,单位s
axisPointer: { // 坐标轴指示器,坐标轴触发有效
type: 'cross', // 默认为直线,可选为:'line' | 'shadow'
label: {
show: true,
}
},
position: function (point, params, dom, rect, size) {
// dom.innerHTML = `
// 累计客流达成率: ${ params[0]['data']}
// 当天累计客流量: ${ params[1]['data']}
// `
}
},
grid: {//控制网格和本身的距离
// left: '3%',
// right: '4%',
// containLabel: true
show: true,
},
xAxis: [{
type: 'category',
data: dataScope('2017-6-30', '2017-10-1'),
// axisLabel: {
// interval: 1,
// margin: 2,
// },
// axisTick: {
// alignWithLabel: true
// },
// axisLine: {
// lineStyle: {
// }
// }
// show: true,
// axisTick: {
// show: false,
// },
axisLabel: {
textStyle: {//控制坐标轴刻度上的文字的样式
color: '#3b3b3b',
fontFamily: 'MicrosoftYaHei',
fontSize: 20,
}
},
axisLine: {
lineStyle: {////控制坐标线的样式
color: 'red'
}
},
markPoint: {//控制显示最大值和最小值
data: [{
type: 'max',
name: '最大值'
},
{
type: 'min',
name: '最小值'
}
]
},
}],
yAxis: [{
type: 'value',
min: '0',
max: 'dataMax',
data: [0, 10, 20, 30, 40, 50, 60],
axisTick: {
show: false
},
axisLine: {
lineStyle: {
color: '#e2e2e2',
}
},
axisLabel: {
show: true,
textStyle: {
color: '#3b3b3b',
fontFamily: 'MicrosoftYaHei',
fontSize: 12,
}
},
// splitArea: {
// }
splitLine: {//控制网格线的样式
lineStyle: {
color: 'red',
}
},
axisPointer: {
show: false
}
}],
formatter: function (params) {
if (params.value == 14) {
return '';
} else {
return params.value;
}
},
series: [{
name: '直接访问',
type: 'bar',
barWidth: 12,//控制柱状图的宽度
data: [4, 7, 9, 10, 12, , 12, 3, 10, 12, 14, 29, 23, 3, 10, 12, 14, 29, 23, 3, 10,
12, 14, 29, 23, 3, 10, 12, 14, 29, 23, 10, 12, 14, 29, 23, 3, 10, 12, 14,
29, 23, 10, 12, 14, 29, 23, 3, 10, 12, 14, 29, 23, 14, 29, 23, 3, 10, 12,
14, 29, 14, 29, 23, 3, 10, , 14, 29, 23, 3, 10, 12, 14, 29, 14, 29, , 29,
14, 29, , 29, 14, 29, 23, 3, 10, 12, 14, 29, 12, 14, 29
],
markPoint: {
symbol: 'circle',
symbolSize: 10,
color: 'transparent',
label: {
normal: {
show: true,
fontSize: 12,
color: '#000',
offset: [0, -15]
}
},
itemStyle: {
normal: {
color: 'transparent',
}
},
data: [{
type: 'max',
name: '最大值'
},
{
type: 'min',
name: '最小值'
}
]
},
itemStyle: {
normal: {
color: function (params) {
var index_color = params.value;
if (index_color >= 20) {
return '#7191b8';
} else {
return '#e65d4d';
}
},
width: 12,
label: {
// show: true,
// position: 'top'
}
},
emphasis: {
shadowBlur: 10,
shadowOffsetX: 0,
shadowColor: 'rgba(0, 0, 0, 0.5)'
}
}
}]
};
var option2 = {
toolbox: {
show: true,
feature: {
dataZoom: {
yAxisIndex: 'none'
},
dataView: {
optionToContent: function (opt) {
var otc = 'graph.html?formData=yuYueData&title=预约日报表';
return otc;
}
},
magicType: {
type: ['line', 'bar']
},
restore: {},
saveAsImage: {}
},
right: 80
},
dataZoom: [{
type: 'slider',
start: 0,
end: 20,
height: 15,
show: false
}],
title: {
show: false,
text: '每日客流达成率',
textStyle: {
fontSize: 14,
fontFamily: 'MicrosoftYaHei',
fontWeight: "lighter",
color: '#808080'
},
// top: 16,
// left: 45,
// padding: 8,
// borderColor: '#58a',
// borderWidth: 3
},
tooltip: {
show: true,
trigger: 'item', // 触发类型,默认数据触发,见下图,可选为:'item' ¦ 'axis'
showDelay: 20, // 显示延迟,添加显示延迟可以避免频繁切换,单位ms
hideDelay: 100, // 隐藏延迟,单位ms
transitionDuration: 0.4, // 动画变换时间,单位s
axisPointer: { // 坐标轴指示器,坐标轴触发有效
type: 'cross', // 默认为直线,可选为:'line' | 'shadow'
label: {
show: true,
},
crossStyle: {
}
},
position: function (point, params, dom, rect, size) {
// dom.innerHTML = `
// 累计客流达成率: ${ params[0]['data']}
// 当天累计客流量: ${ params[1]['data']}
// `
},
// formatter:
//position: ['50%', '50%'], //相对位置,放置在容器正中间
// backgroundColor: 'red',
},
legend: {
data: [{
name: '每日客流达成率',
icon: 'line',
}, {
name: '七日均线',
icon: 'line'
}],
itemWidth: 20,
itemHeight: 20,
textStyle: {
color: '#3b3b3b',
fontFamily: 'SourceHanSansCN-Light',
fongSize: 12,
},
// selected: {
// '每日客流达成率': true,
// '七日均线': true
// // 不想显示的都设置成false
// },
itemGap: 40
},
grid: {
// left: '2%',
// right: '4%',
bottom: '2%',
show: true,
// containLabel: true
},
xAxis: {
type: 'category',
color: '#3b3b3b',
boundaryGap: false,
data: dataScope('2017-6-30', '2017-10-1'),
show: false,
axisTick: {
show: false,
},
axisLabel: {
show: true,
textStyle: {
color: '#3b3b3b',
fontFamily: 'MicrosoftYaHei',
fontSize: 12,
align: 'right'
}
},
boundaryGap: true,
axisLine: {
onZeroAxisIndex: 0
},
// axisLine: {
// lineStyle: {
// width: 1,
// color: '#e2e2e2'
// }
// }
},
yAxis: {
type: 'value',
data: [80, 100, 120, 140, 160, 180],
min: 'dataMin',
max: 'dataMax',
axisLabel: {
formatter: '{value}%',
show: true,
textStyle: {
color: '#3b3b3b',
fontFamily: 'MicrosoftYaHei',
fontSize: 12,
}
},
axisTick: {
show: false
},
axisLine: {
lineStyle: {
color: '#e2e2e2',
}
},
splitLine: {
lineStyle: {
color: '#f9f9f9',
}
}
},
series: [{
name: '每日客流达成率',
type: 'line',
itemStyle: {
normal: {
label: {
// show: true
},
color: '#7191b8'
}
},
lineStyle: {
normal: {
// color: 'red'
}
},
connectNulls: true,
smooth: false,
data: [140.33, 119.07, 51.03, 55.28, 63.79, 85.05, 93.55, 153.08, 136.07, 51.03,
55.28, 63.79, 55.28, 59.53, 148.83, 140.33, 46.78, 63.79, 72.29, 63.79,
93.55, 136.07, 161.59, 51.03, 51.03, 59.53, 63.79, 55.28, 148.83, 136.07,
51.03, 55.28, 63.79, 59.53, 68.04, 161.59, 148.83, 51.03, 46.78, 63.79,
68.04, 80.79, 178.60, 161.59, 63.79, 59.53, 68.04, 80.79, 93.55, 174.35,
170.09, 68.04, 63.79, 72.29, 85.05, 102.06, 178.60, 170.09, 68.04, 68.04,
72.29, 89.30, 106.31, 187.10, 174.35, 72.29, 63.79, 72.29, 85.05, 102.06,
195.61, 182.85, 76.54, 68.04, 85.05, 93.55, 110.56, 204.11, 191.36, 80.79,
72.29, 85.05, 97.80, 114.81, 212.62, 204.11, 85.05, 76.54, 93.55, 106.31,
119.07
],
showSymbol: false,
markPoint: {
symbol: 'circle',
symbolSize: 10,
color: 'red',
label: {
normal: {
show: true,
fontSize: 12,
color: '#000',
offset: [0, -15]
}
},
itemStyle: {
normal: {
color: 'red',
}
},
data: [{
type: 'max',
name: '最大值'
},
{
type: 'min',
name: '最小值'
}
]
}
}, {
name: '七日均线',
type: 'line',
smooth: false,
itemStyle: {
normal: {
label: {
show: true
},
color: '#e65d4d'
}
},
connectNulls: true,
data: [33, 28, 12, 13, 15, 20, 22, 36, 32, 12, 13, 15, 13, 14, 35, 33, 11, 15, 17,
15, 22, 32, 38, 12, 12, 14, 15, 13, 35, 32, 12, 13, 15, 14, 16, 38, 35, 12,
11, 15, 16, 19, 42, 38, 15, 14, 16, 19, 22, 41, 40, 16, 15, 17, 20, 24, 42,
40, 16, 16, 17, 21, 25, 44, 41, 17, 15, 17, 20, 24, 46, 43, 18, 16, 20, 22,
26, 48, 45, 19, 17, 20, 23, 27, 50, 48, 20, 18, 22, 25, 28
],
markPoint: {
symbol: 'circle',
symbolSize: 10,
color: '#58a',
label: {
normal: {
show: true,
fontSize: 12,
color: 'blue',
offset: [0, -15]
}
},
itemStyle: {
normal: {
color: 'blue',
}
},
data: [{
type: 'max',
name: '最大值'
},
{
type: 'min',
name: '最小值'
}
]
},
showSymbol: false,
}]
};
var myChart = echarts.init(document.getElementById('main1'));
myChart.setOption(option1);
var myChart2 = echarts.init(document.getElementById('main2'));
myChart2.setOption(option2);
echarts.connect([myChart, myChart2]);