上一次已经初步学会了通过workbook配置,实现简单excel导出,但是excel不是简单的表格光有数据就完了,如果是那样我直接用逗号分隔符创建csv就好了。
这次,我来看看如何实现样式,我要实现的功能有
1.单元格合并
2.列宽设置
3.样式设置 对齐方式 字体/背景颜色 边框
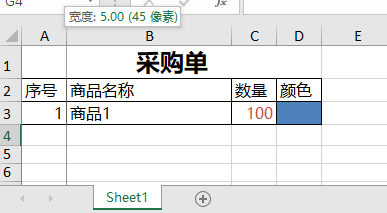
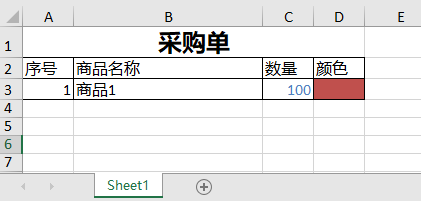
我先用excel做了包含这些功能的简单范本,最终希望用js-xlsx重现
但是经过尝试,已经确认 SheetJS/xlsx 导出excel时
cell的
s样式配置是无效的,他们提供了一个 Pro Version
,似乎只有使用这个专业版才能实现这个功能。
不过我很快找到了替代品 protobi/js-xlsx
npm install xlsx-style
斯巴达,我的项目一引用这个包就无法正常运行了
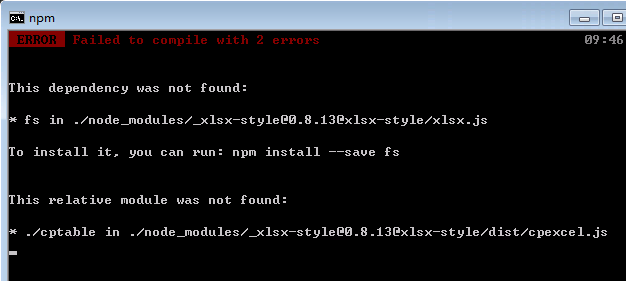
会抛出这个错误,不知道是这个包有问题还是我的环境有问题,已经尝试在项目上安装
fs dev也安装
fs依然没解决。
使用protobi/js-xlsx
我只能采用传统页面加载方式来使用,从他们的git上clone了项目,在页面上加载xlsx.core.min.js文件,因为用前端加载,同时也要引入Blob和 file-saver ,我在搜索引擎上找到了一个简单的函数来实现 file-saver 的功能,当前项目代码如下
因为只是学习测试,我直接用简练的es6语法,实现功能为主,不考虑浏览器兼容性问题
1.单元格合并sheet['!merges']
回顾官方文档,sheet提供了一个配置项!merges用来实现单元格合并
使用之前先了解它的用法,sheet['!merges']接受一个数组参数,数组对象的格式如下
[
  {
    s: { //s start 开始
      c: 1,//cols 开始列
      r: 0 //rows 开始行
    },
    e: {//e end  结束
      c: 4,//cols 结束列
      r: 0 //rows 结束行
    }
  }
]
为了实现合并A1:D1我给sheet['!merges']增加对应配置,现在的workbook如下
const workbook = {
  SheetNames: ['Sheet1'],
  Sheets: {
    Sheet1: {
      '!ref': 'A1:D4',
      '!merges': [{
        s: {c: 0, r: 0},
        e: {c: 3, r: 0}
      }],
      A1: {v: '采购单', t: 's'},
    }
  }
};
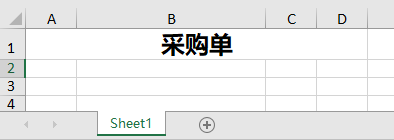
运行导出,成功
2.列宽设置 sheet['!cols']
sheet提供了一个配置项!cols用来实现设置列宽
[
  {
    hidden? : boolean, //列的显示true或隐藏false
    /* column width is specified in one of the following ways: */
    wpx? : number, // 列宽 单位是像素
    width? : number,  // width in Excel's "Max Digit Width", width*256 is integral
    wch? : number,  // width in characters
    /* other fields for preserving features from files */
    MDW? : number,  // Excel's "Max Digit Width" unit, always integral
  }
]
我的示例中的单元格宽度是 45px 165px 45px 45px
配置一下
'!cols': [{wpx: 45}, {wpx: 165}, {wpx: 45}, {wpx: 45}]
运行导出
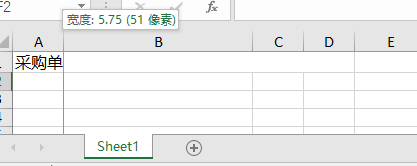
可以看到列宽有被正确配置,但是产生的宽度是 51px 189px 51px 51px,虽然有误差,不过配置项有效,误差原因就不深究了
清注意,下面的功能由
xlsx-style实现 ,对xlsx无效
样式配置表
| 样式属性 | 子属性 | 参数 |
|---|---|---|
| fill | patternType | "solid" or "none"” |
| fgColor | COLOR_SPEC | |
| bgColor | COLOR_SPEC | |
| font | name | "Calibri" // default |
| sz | "11" // font size in points | |
| color | COLOR_SPEC | |
| bold | true or false | |
| underline | true or false | |
| italic | true or false | |
| strike | true or false | |
| outline | true or false | |
| shadow | true or false | |
| vertAlign | true or false | |
| numFmt | "0" // integer index to built in formats, see StyleBuilder.SSF property | |
| "0.00%" // string matching a built-in format, see StyleBuilder.SSF | ||
| "0.0%" // string specifying a custom format | ||
| "0.00%;\(0.00%\);\-;@" // string specifying a custom format, escaping special characters | ||
| "m/dd/yy" // string a date format using Excel's format notation | ||
| alignment | vertical | "bottom" or "center" or "top" |
| horizontal | "bottom" or "center" or "top" | |
| wrapText | true or false | |
| readingOrder | 2 // for right-to-left | |
| textRotation | Number from 0 to 180 or 255 (default is 0) | |
| 90 is rotated up 90 degrees | ||
| 45 is rotated up 45 degrees | ||
| 135 is rotated down 45 degrees | ||
| 180 is rotated down 180 degrees | ||
| 255 is special, aligned vertically | ||
| border | top | { style: BORDER_STYLE, color: COLOR_SPEC } |
| bottom | { style: BORDER_STYLE, color: COLOR_SPEC } | |
| left | { style: BORDER_STYLE, color: COLOR_SPEC } | |
| right | { style: BORDER_STYLE, color: COLOR_SPEC } | |
| diagonal | { style: BORDER_STYLE, color: COLOR_SPEC } | |
| diagonalUp | true or false | |
| diagonalDown | true or false |
COLOR_SPEC: 填充、字体和边框的颜色对象:
- { auto: 1}指定自动值
- { rgb: "FFFFAA00" } 指定16进制的ARGB
- { theme: "1", tint: "-0.25"} 指定主题颜色和色调的整数索引(默认值为0)
- { indexed: 64} 默认值 fill.bgColor
BORDER_STYLE: 边框样式是一个字符串值,它可以是以下值之一:
- thin
- medium
- thick
- dotted
- hair
- dashed
- mediumDashed
- dashDot
- mediumDashDot
- dashDotDot
- mediumDashDotDot
- slantDashDot
2.样式设置
我的测试范例中标题“采购单”是水平居中对齐,18号加粗字体
给A1增加对应配置
A1: {
  v: '采购单',
  t: 's',
  s: {
    font: {
      sz: 18,                //18号字体
      bold: true             //加粗
    },
    alignment: {
      horizontal: 'center'   //水平居中对其
    }
  }
}
运行导出
配置有效!我很快就按配置表写出下面的
workbook
const borderAll = {  //单元格外侧框线
  top: {
    style: 'thin'
  },
  bottom: {
    style: 'thin'
  },
  left: {
    style: 'thin'
  },
  right: {
    style: 'thin'
  }
};

const workbook = {
  SheetNames: ['Sheet1'],
  Sheets: {
    Sheet1: {
      '!ref': 'A1:D4',
      '!cols': [{wpx: 45}, {wpx: 165}, {wpx: 45}, {wpx: 45}],
      '!merges': [{
        s: {c: 0, r: 0},
        e: {c: 3, r: 0}
      }],
      A1: {
        v: '采购单',
        t: 's',
        s: {
          font: {
            sz: 18,
            bold: true
          },
          alignment: {
            horizontal: 'center'
          }
        }
      },
      A2: {
        v: '序号',
        t: 's',
        s: {
          border: borderAll
        }
      },
      B2: {
        v: '商品名称',
        t: 's',
        s: {
          border: borderAll
        }
      },
      C2: {
        v: '数量',
        t: 's',
        s: {
          border: borderAll
        }
      },
      D2: {
        v: '颜色',
        t: 's',
        s: {
          border: borderAll
        }
      },
      A3: {
        v: 1,
        t: 'n',
        s: {
          border: borderAll
        }
      },
      B3: {
        v: '商品1',
        t: 's',
        s: {
          border: borderAll
        }
      },
      C3: {
        v: 100,
        t: 'n',
        s: {
          border: borderAll,
          font: {
            color: {
              rgb: 'FF4F81BD'  //字体颜色
            }
          }
        }
      },
      D3: {
        v: '',
        s: {
          border: borderAll,
          fill: {
            fgColor: {
              rgb: 'FFC0504D'  //背景颜色
            }
          }
        }
      }
    }
  }
};
运行
到此,本次对使用js-xlsx导出excel的学习基本告一段落,可以准备投入生产了
