利用 SimpleXMLRPCServer 演示 简单RPC例子
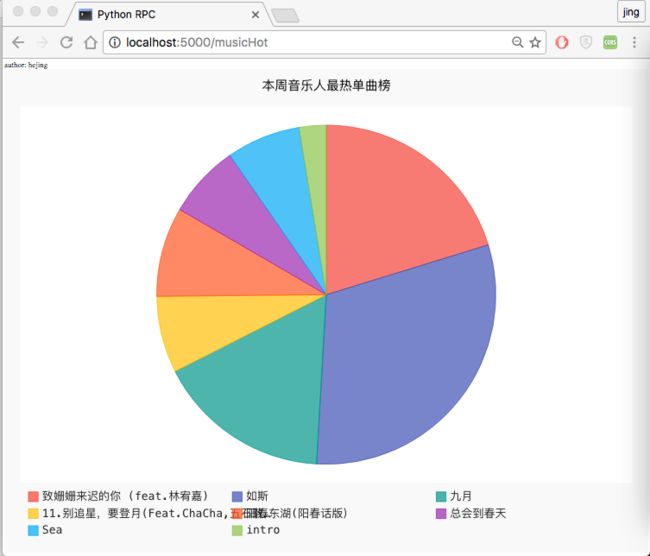
最后效果
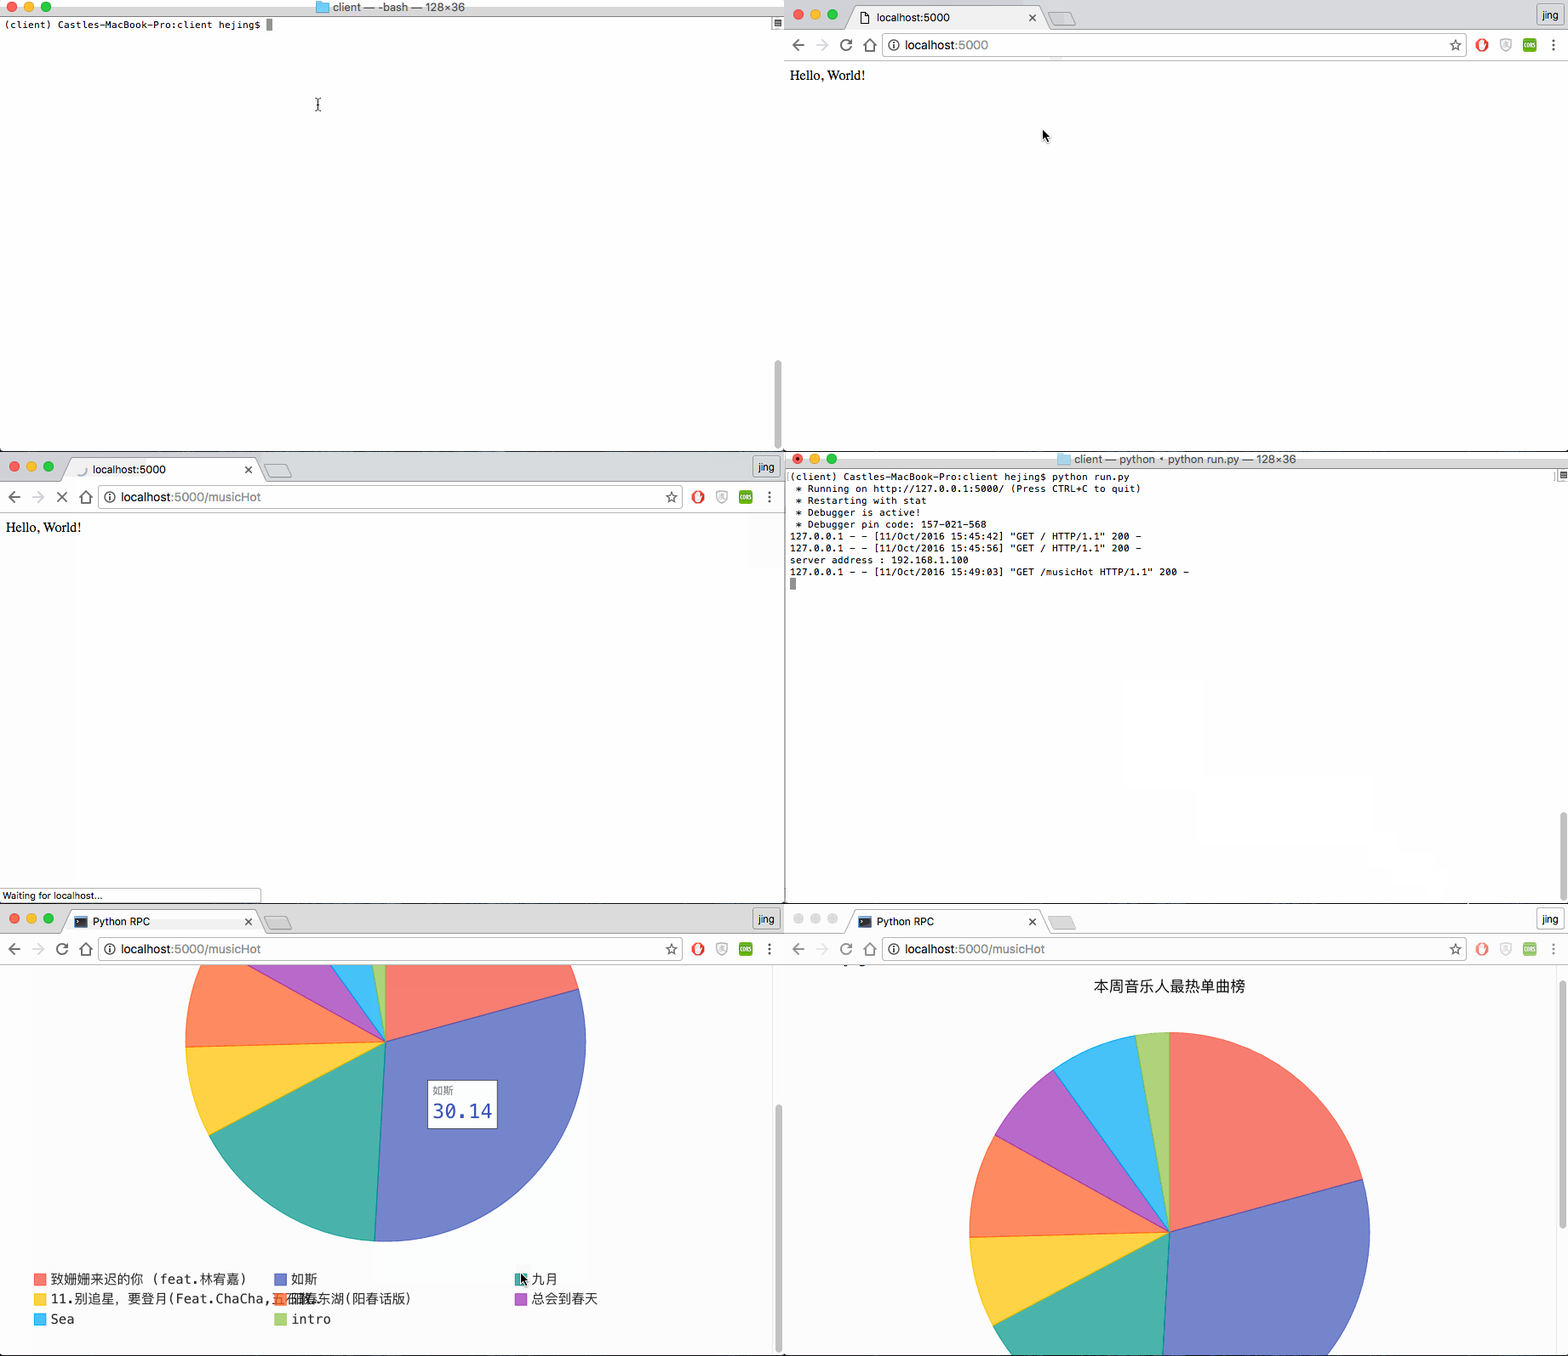
动图演示
服务端
客户端
思路:
服务器端 写了一个小爬虫,获取豆瓣音乐的热门榜,获取数据。
客户端 tcp 链接 服务器端,调用服务器爬虫的方法,并得到返回数据。将数据可视化图表。
需要安转包
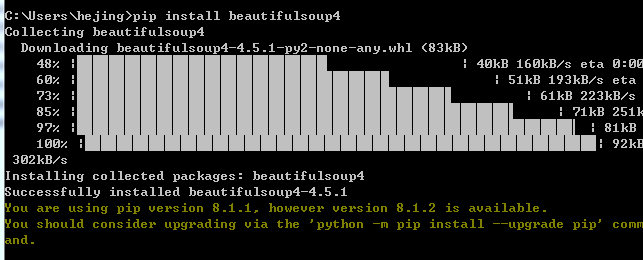
服务端 需要安装 beautifulsoup4 来解析网页,爬取数据
pip install beautifulsoup4
客户端 需要安装 flask web框架 和 pygal 生成图表
pip install flask
pip install pygal
代码
服务器端代码:
#-*- coding: utf-8 -*-
import urllib2
from bs4 import BeautifulSoup
import json
import string
from SimpleXMLRPCServer import SimpleXMLRPCServer
import sys,os
reload(sys)
sys.setdefaultencoding('utf8')


def music():
    url = "https://music.douban.com/chart"

    html = urllib2.urlopen(url).read().decode("utf-8")
    soup = BeautifulSoup(html,"html.parser")

    items = soup.findAll('li',attrs={"class":"clearfix"},limit=8)
    print "starting..."

    print len(items)

    result = []
    nStr = ""
    for item in items:
        aTags = item.find('a')
        # get cover img
        img = aTags.find('img')
        img = img.attrs['src']
        img = nStr.join(img)
        # link
        link = aTags.attrs['href']
        link = nStr.join(link)
        # title
        title = item.find("h3").get_text()
        title = nStr.join(title)

        # team and num
        team = item.find("p").get_text()
        num = team.split("/")[1].strip()

        team = team.split("/")[0].strip()
        team = nStr.join(team)
        num = num.replace('次播放','')
        num = num.replace(' ','')
        num = nStr.join(num)
        num = int(num)
        # add to tuple
        result.append((img,link,title,team,num))

        # print img +" : "+ link + " : " + title + " : " + num +" : " + team
    # print result
    return result


address = raw_input("server address : ")

# A simple server with simple arithmetic functions
server = SimpleXMLRPCServer((address, 8000),  allow_none = True)
print "Listening on port 8000..."
server.register_multicall_functions()
server.register_function(music,'music')
server.serve_forever()
客户端代码
flask 结构如下
client
  app
    --static
    --templates
    views.py
    __init__.py
  run.py
static 文件夹内放 需要调用的js文件 pygal-tooltips.min.js 官网
templates文件夹内放置 html的模板文件
charts.html
    Python RPC


    author: hejing
views.py
#-*- coding: utf-8 -*-

from app import app
import xmlrpclib
import pygal
from pygal.style import DefaultStyle
from flask import render_template
import sys,os
reload(sys)
sys.setdefaultencoding('utf8')


@app.route('/')
@app.route('/index')
def index():
    return "Hello, World!"

@app.route('/musicHot')
def musicHot():
    address = raw_input("server address : ")
    proxy = xmlrpclib.ServerProxy("http://"+ address +":8000/", allow_none = True)
    multicall = xmlrpclib.MultiCall(proxy)
    multicall.music()
    result = multicall()
    result = tuple(result)
    total = 0;
    for i in range(len(result)):
        temp = result[i]
        for j in range(len(temp)):
            temp2 = temp[j]
            num = int(temp2[-1])
            total = total +  num

    # print total

    pie_chart = pygal.Pie(legend_at_bottom=True)
    title = pie_chart.title = '本周音乐人最热单曲榜  '

    # print "----------\n"
    for i in range(len(result)):
        temp = result[i]
        for j in range(len(temp)):
            temp2 = temp[j]
            num = int(temp2[-1])
            percent = round((num*100.0) / (1.0*total),2)
            pie_chart.add(temp2[-3],percent)

            # for k in range(len(temp2)):
            #   # print temp2[k]
            #   if k == len(temp2):
            #       num = int(temp2[-1])
            #       percent = (num*100.0) / (1.0*total)


            # print "%d %.2f" % (num, percent )
            # print "----------\n"

    chart = pie_chart.render_data_uri()
    return render_template('charts.html', chart = chart)
    # return render_template('charts.html', chart = tuple(result))


@app.route('/show')
def show():
    pie_chart = pygal.Pie(egend_at_bottom=True)
    title = pie_chart.title = 'Browser usage in February 2012 (in %)'
    pie_chart.add('IE', 19.5)
    pie_chart.add('Firefox', 36.6)
    pie_chart.add('Chrome', 36.3)
    pie_chart.add('Safari', 4.5)
    pie_chart.add('Opera', 2.3)
    # chart = pie_chart.render()
    chart = pie_chart.render_data_uri()
    return render_template('charts.html', chart = chart)
    # return render_template('charts.html',chart = chart)
    # html = """
    #
    #
    # %s
    #
    #
    # %s
    #
    #
    # """ % (title, pie_chart.render())
    # return html
"init.py"
from flask import Flask

app = Flask(__name__)
from app import views
运行
服务端运行
$ python douban.py
server address :
运行服务器端的 douban.py文件
会提示你输入本机的ip
输入完之后,服务器就一直运行
$ python douban.py
server address : 192.168.1.103
Listening on port 8000...
客户端运行
$ python run.py
 * Running on http://127.0.0.1:5000/ (Press CTRL+C to quit)
 * Restarting with stat
 * Debugger is active!
 * Debugger pin code: 157-021-568
已经提示已经运行, 这个时候在浏览器上输入
http://localhost:5000/ 就会显示 Hello, World!
我们地址再改成
http://localhost:5000/musicHot
$ python run.py
 * Running on http://127.0.0.1:5000/ (Press CTRL+C to quit)
 * Restarting with stat
 * Debugger is active!
 * Debugger pin code: 157-021-568
127.0.0.1 - - [11/Oct/2016 13:55:58] "GET / HTTP/1.1" 200 -
server address :
会提示让你输入服务端的地址
$ python run.py
 * Running on http://127.0.0.1:5000/ (Press CTRL+C to quit)
 * Restarting with stat
 * Debugger is active!
 * Debugger pin code: 157-021-568
127.0.0.1 - - [11/Oct/2016 13:55:58] "GET / HTTP/1.1" 200 -
server address : 192.168.1.103
127.0.0.1 - - [11/Oct/2016 13:59:12] "GET /musicHot HTTP/1.1" 200 -
我们再看下浏览器


