前言:
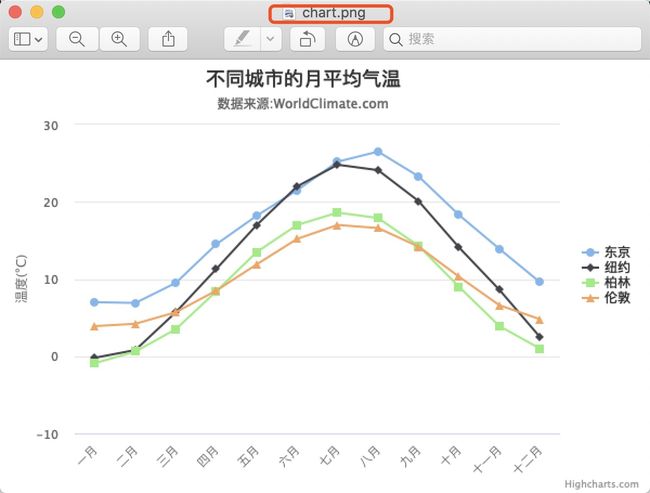
    有这么一个需求,是定时任务,需要定时发送邮件,邮件中数据统计图,该图片是有 Highcharts 生成。所以无论从美观还是其他方面都是最好的。所以现在前端统计都会使用 Highcharts 插件来做统计图。
    问题就来了,定时任务如何生成 Highcharts统计图?首先 Highcharts是不支持 java 的,只支持 node.js、 Android 和 iOS,总之他支持由前端来使用进行渲染。
    但是他支持另外一种形式:highcharts-export-server。
注意:使用 highcharts-export-server 之前,你需要安装 node.js 服务器。
第一步:了解官网(永远是最权威的)
- https://www.highcharts.com.cn/docs/setting-up-the-server
- https://www.highcharts.com.cn/docs/render-charts-serverside
第二步: 安装 highcharts-export-server
- 官网上提供了安装方式
- 第一种 npm
npm install highcharts-export-server -g
- 第二种
git clone https://github.com/highcharts/node-export-server
npm install
npm link
- 第一种 npm
- 由于是外网下载,建议使用 淘宝镜像下载(推荐)
- 安装镜像(不会的,自行百度)
npm config set registry https://registry.npm.taobao.org
-
使用镜像进行安装
cnpm install highcharts-export-server -g
- 安装过程可能会出现这个(能选 y的选 y,不能的直接 回车)
Agree to the license terms? y/n: (no) y Select your Highcharts version (e.g. 4.2.2):: (latest) Include Maps? (requires Maps license): (no) Include Gantt? (requires Gantt license, and >V6.2): (no) Enable styled mode? (requires Highcharts/Highstock 5+ license): (no) Include moment.js for date/time handling?: (no) Which CDN would you like to use?: (https://code.highcharts.com/) Enable wordcloud support? y/n: (no) y Enable annotations support? y/n: (no) y Pulling Highcharts from CDN (latest).. - 安装过程中,也遇到了报错(没去管他,能正常运行)
Downloading highcharts-export-server-g to /usr/local/lib/node_modules/highcharts-export-server-g_tmp
Error: GET https://r.npm.taobao.org/highcharts-export-server-g response 404 status
    at get (/usr/local/lib/node_modules/cnpm/node_modules/npminstall/lib/get.js:68:17)
    at get.next (<anonymous>)
    at onFulfilled (/usr/local/lib/node_modules/cnpm/node_modules/co/index.js:65:19)
    at processTicksAndRejections (internal/process/task_queues.js:97:5)
npminstall version: 3.27.0
- 安装镜像(不会的,自行百度)
第三步:测试安装是否成功(显示该内容就表示安装好了)。
➜  ~ highcharts-export-server
    __  ___       __         __               __
   / / / (_)___ _/ /_  _____/ /_  ____ ______/ /______
  / /_/ / / __ `/ __ \/ ___/ __ \/ __ `/ ___/ __/ ___/
 / __  / / /_/ / / / / /__/ / / / /_/ / /  / /_(__  )
/_/ /_/_/\__, /_/ /_/\___/_/ /_/\__,_/_/   \__/____/
        ____//___/                  __     _____
       / ____/  ______  ____  _____/ /_   / ___/___  ______   _____  _____
      / __/ | |/_/ __ \/ __ \/ ___/ __/   \__ \/ _ \/ ___/ | / / _ \/ ___/
     / /____>   /_/ / /_/ / /  / /_    ___/ /  __/ /   | |/ /  __/ /
    /_____/_/|_/ .___/\____/_/   \__/   /____/\___/_/    |___/\___/_/
              /_/

                                                                  v2.0.24
Usage:
第四步:启动 highcharts-export-server --enableServer 1 --port 3000
- 启动 highcharts-export-server 你需要知道 他具体位置
➜ ~ which highcharts-export-server /usr/local/bin/highcharts-export-server - 切换到 /usr/local/bin/highcharts-export-server 地址
- 但是 highcharts-export-server 是个脚本文件,所以只能切换到 /usr/local/bin/ 下
~ cd /usr/local/bin/
- 启动方式:highcharts-export-server --enableServer 1 --port 3000
➜  bin highcharts-export-server --enableServer 1 --port 3000
    __  ___       __         __               __
   / / / (_)___ _/ /_  _____/ /_  ____ ______/ /______
  / /_/ / / __ `/ __ \/ ___/ __ \/ __ `/ ___/ __/ ___/
 / __  / / /_/ / / / / /__/ / / / /_/ / /  / /_(__  )
/_/ /_/_/\__, /_/ /_/\___/_/ /_/\__,_/_/   \__/____/
        ____//___/                  __     _____
       / ____/  ______  ____  _____/ /_   / ___/___  ______   _____  _____
      / __/ | |/_/ __ \/ __ \/ ___/ __/   \__ \/ _ \/ ___/ | / / _ \/ ___/
     / /____>   /_/ / /_/ / /  / /_    ___/ /  __/ /   | |/ /  __/ /
    /_____/_/|_/ .___/\____/_/   \__/   /____/\___/_/    |___/\___/_/
              /_/

                                                                  v2.0.24
- 到此 highcharts-export-server就启动好了,这不是以守护进程启动,所以就额外开启了一个终端。
第五步:测试图片生成
- 使用官网给的json 进行测试
{"title":{"text":"不同城市的月平均气温","x":-20},"subtitle":{"text":"数据来源:WorldClimate.com","x":-20},"xAxis":{"categories":["一月","二月","三月","四月","五月","六月","七月","八月","九月","十月","十一月","十二月"]},"yAxis":{"title":{"text":"温度(°C)"},"plotLines":[{"value":0,"width":1,"color":"#808080"}]},"tooltip":{"valueSuffix":"°C"},"legend":{"layout":"vertical","align":"right","verticalAlign":"middle","borderWidth":0},"series":[{"name":"东京","data":[7,6.9,9.5,14.5,18.2,21.5,25.2,26.5,23.3,18.3,13.9,9.6]},{"name":"纽约","data":[-0.2,0.8,5.7,11.3,17,22,24.8,24.1,20.1,14.1,8.6,2.5]},{"name":"柏林","data":[-0.9,0.6,3.5,8.4,13.5,17,18.6,17.9,14.3,9,3.9,1]},{"name":"伦敦","data":[3.9,4.2,5.7,8.5,11.9,15.2,17,16.6,14.2,10.3,6.6,4.8]}]} - 在本地生成一份以 .json 为扩展的文件并保存以上内容(如:options.json)。
- 命令行的方式方式:运行成功会是这样。
document highcharts-export-server --infile options.json --outfile ~/work/document/chart.png
    __  ___       __         __               __
   / / / (_)___ _/ /_  _____/ /_  ____ ______/ /______
  / /_/ / / __ `/ __ \/ ___/ __ \/ __ `/ ___/ __/ ___/
 / __  / / /_/ / / / / /__/ / / / /_/ / /  / /_(__  )
/_/ /_/_/\__, /_/ /_/\___/_/ /_/\__,_/_/   \__/____/
        ____//___/                  __     _____
       / ____/  ______  ____  _____/ /_   / ___/___  ______   _____  _____
      / __/ | |/_/ __ \/ __ \/ ___/ __/   \__ \/ _ \/ ___/ | / / _ \/ ___/
     / /____>   /_/ / /_/ / /  / /_    ___/ /  __/ /   | |/ /  __/ /
    /_____/_/|_/ .___/\____/_/   \__/   /____/\___/_/    |___/\___/_/
              /_/

                                                                  v2.0.2
- java 测试(代码比较简单,直接就可以运行)。
public static void main(String[] args) {

        String options = "/Users/zhangzhonghui/work/document/options.json";
        String outPath = "/Users/zhangzhonghui/work/document/char1.png";

        String cmd = "highcharts-export-server --infile " + options + " --outfile "+outPath;

        try {
            Runtime run = Runtime.getRuntime();
            Process p = run.exec(cmd);

            BufferedInputStream in = new BufferedInputStream(p.getInputStream());
            BufferedReader inBr = new BufferedReader(new InputStreamReader( in ));
            String lineStr;

            while ((lineStr = inBr.readLine()) != null) {
                System.out.println(lineStr);
            }

            inBr.close(); in .close();

        } catch (IOException e) {
            e.printStackTrace();
        }

    }
结论:
    以上内容,百分之90来自于官网,该功能在实际开发中还是比较重要的,否则我也不会接触到它。
    其实还有很多疑问,需要我去发掘,如:如何不生成文件,而是返回一个流?这个问题就是我接下来要去琢磨的。
