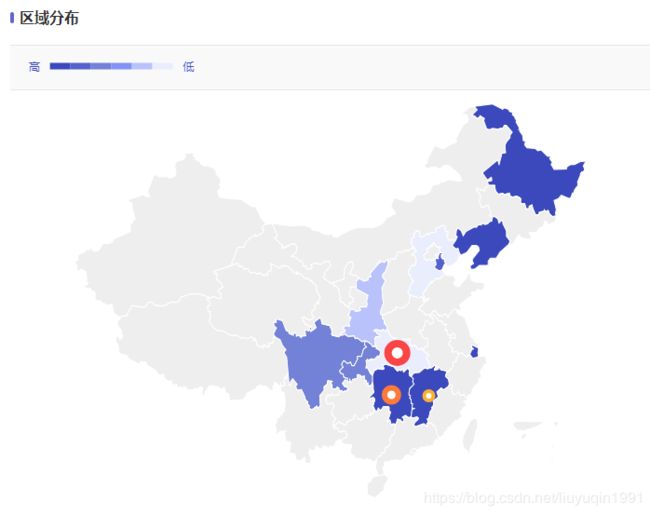
echarts大制作:绚丽地图
实现:
前提:
- 引入最新版的echarts(npm install echarts --save)
- 引入自定义地图配置类CommonEchartsConfig(https://github.com/liuyuqin1991/ecf)
- 引入中国地图Geo数据ChinaJson,这个文件没法上传做附件,可自行在网上找一个类似于下图格式的json即可

代码:
import echarts from 'echarts';
import {CommonEchartsConfig} from '../../util/echarts/CommonEchartsConfig';
import ChinaJson from './china.json';

let arealDistributionCharts;

/**
* componentId echarts dom Id
* data 图表数据 data:{min:0,nax:647,mapData:[{name: "湖北", value: 647},{name: "湖南", value: 349}]} 必须包含min,max,mapData这三个属性
*
*/
renderArealDistributionEcharts:function (componentId,data) {
 //载入数据
 let option= CommonEchartsConfig.initDefaultMap('',['成交金额'],[data.mapData],null,data.max);
 if(document.getElementById(componentId)!= null){
  //配置rank1,2,3名的markpoint
  let markPointData = [];
  for (let p of ChinaJson.features){
   if (data.mapData && data.mapData[0] && data.mapData[0].name.indexOf(p.properties.name) > -1){
    markPointData.push({
     coord: p.properties.cp,
     symbol:'circle',
     symbolSize:20,
     lebel:{
      show:false,
     },
     itemStyle:{
      color:'#FFF',
      borderWidth:8,
      borderColor:'#FB4444',
     },
    });
   }
   if (data.mapData && data.mapData[1] && data.mapData[1].name.indexOf(p.properties.name) > -1){
    markPointData.push({
     coord: p.properties.cp,
     symbol:'circle',
     symbolSize:15,
     lebel:{
      show:false,
     },
     itemStyle:{
      color:'#FFF',
      borderWidth:6,
      borderColor:'#FF7A3A',
     },
    });
   }
   if (data.mapData && data.mapData[2] && data.mapData[2].name.indexOf(p.properties.name) > -1){
    markPointData.push({
     coord: p.properties.cp,
     symbol:'circle',
     symbolSize:10,
     lebel:{
      show:false,
     },
     itemStyle:{
      color:'#FFF',
      borderWidth:4,
      borderColor:'#FBB02F',
     },
    });
   }
  }
  //加载地图geoJson
  echarts.registerMap('china', ChinaJson);
  //初始化地图
  arealDistributionCharts = echarts.init(document.getElementById(componentId));
  //自定义地图配置
  CommonEchartsConfig.setMapRoam(option);
  CommonEchartsConfig.setToolboxIsShow(option,false);
  let toolTipAttr = {
   backgroundColor:'#FFF',
   borderColor:'#EAEAEA',
   borderWidth:1,
   padding:10,
   formatter:function (params) {
    let _html;
    if(params && params.name){
     _html= ""+params.name+"
"+
      "成交金额:"+formatData.formatAmount(params.value,2)+"
";
    }
    return _html;
   }
  };
  CommonEchartsConfig.setTooltipAttr(option,toolTipAttr);
  let mapAttr = {
   left:'10%',
   top:'12%',
   label:{
    show:false,
   },
   itemStyle:{
    color:'transparent',
    borderWidth:1,
    borderColor:'#FFF',
   },
   emphasis:{
    label:{
     show:false,
    },
    itemStyle:{
     areaColor:'#ffc1ae',
     borderWidth:1,
     borderColor:'#FFF',
    },
   },
   markPoint:{
    show:true,
    symbolSize: 20,
    itemStyle:{
     color:'blue',
    },
    data:markPointData,
   }
  };
  CommonEchartsConfig.setMapAttr(option,mapAttr);
  let visualMap = [{
   type: 'piecewise', // 定义为连续型 viusalMap
   itemWidth:22,
   itemHeight:7,
   itemGap:0,
   splitNumber:6,
   textGap:10,
   top:12,
   left:15,
   text:['   低','高   '],
   textStyle:{
    color:'#3B49BD',
   },
   inRange:{
    symbol:'rect',
    color: ['#3B49BD','#5562CB','#7381D6','#8393F4','#B9C2FB','#EAEDFC'],
   },
   orient:'horizontal',
   min:parseInt(data.min),
   max:parseInt(data.max),
   calculable : true,
  }];
  CommonEchartsConfig.setVisualMap(option,visualMap);
  arealDistributionCharts.setOption(option,true);
  this.resizeEcharts();
 }
},

//自动渲染地图
resizeEcharts: function () {
 window.onresize = function () {
  arealDistributionCharts.resize();
 };
}
