ID3 算法案例
1. 决策树的基本认识
决策树是一种依托决策而建立起来的一种树。在机器学习中,决策树是一种预测模型,代表的是一种对
象属性与对象值之间的一种映射关系,每一个节点代表某个对象,树中的每一个分叉路径代表某个可能
的属性值,而每一个叶子节点则对应从根节点到该叶子节点所经历的路径所表示的对象的值。决策树仅
有单一输出,如果有多个输出,可以分别建立独立的决策树以处理不同的输出。接下来讲解ID3算法。
2. ID3算法介绍
ID3算法是决策树的一种,它是基于奥卡姆剃刀原理的,即用尽量用较少的东西做更多的事。ID3算法,
即Iterative Dichotomiser 3,迭代二叉树3代,是Ross Quinlan发明的一种决策树算法,这个
算法的基础就是上面提到的奥卡姆剃刀原理,越是小型的决策树越优于大的决策树,尽管如此,也不总
是生成最小的树型结构,而是一个启发式算法。
在信息论中,期望信息越小,那么信息增益就越大,从而纯度就越高。ID3算法的核心思想就是以信息
增益来度量属性的选择,选择分裂后信息增益最大的属性进行分裂。该算法采用自顶向下的贪婪搜索遍
历可能的决策空间。
3. 信息熵与信息增益
在信息增益中,重要性的衡量标准就是看特征能够为分类系统带来多少信息,带来的信息越多,该特征越
重要。在认识信息增益之前,先来看看信息熵的定义
熵这个概念最早起源于物理学,在物理学中是用来度量一个热力学系统的无序程度,而在信息学里面,熵
是对不确定性的度量。在1948年,香农引入了信息熵,将其定义为离散随机事件出现的概率,一个系统越
是有序,信息熵就越低,反之一个系统越是混乱,它的信息熵就越高。所以信息熵可以被认为是系统有序
化程度的一个度量。
假如一个随机变量![]() 的取值为
的取值为![]() ,每一种取到的概率分别是
,每一种取到的概率分别是![]() ,那么
,那么
![]() 的熵定义为
的熵定义为
![]()
意思是一个变量的变化情况可能越多,那么它携带的信息量就越大。
对于分类系统来说,类别![]() 是变量,它的取值是
是变量,它的取值是![]() ,而每一个类别出现的概率分别是
,而每一个类别出现的概率分别是
![]()
而这里的![]() 就是类别的总数,此时分类系统的熵就可以表示为
就是类别的总数,此时分类系统的熵就可以表示为
![]()
以上就是信息熵的定义,接下来介绍信息增益。
信息增益是针对一个一个特征而言的,就是看一个特征![]() ,系统有它和没有它时的信息量各是多少,两者
,系统有它和没有它时的信息量各是多少,两者
的差值就是这个特征给系统带来的信息量,即信息增益。
案例:
本文使用的Python库包括
- numpy
- pandas
- math
- operator
- matplotlib
| Idx | 色泽 | 根蒂 | 敲声 | 纹理 | 脐部 | 触感 | 密度 | 含糖率 | label |
| 1 | 青绿 | 蜷缩 | 浊响 | 清晰 | 凹陷 | 硬滑 | 0.697 | 0.46 | 1 |
| 2 | 乌黑 | 蜷缩 | 沉闷 | 清晰 | 凹陷 | 硬滑 | 0.774 | 0.376 | 1 |
| 3 | 乌黑 | 蜷缩 | 浊响 | 清晰 | 凹陷 | 硬滑 | 0.634 | 0.264 | 1 |
| 4 | 青绿 | 蜷缩 | 沉闷 | 清晰 | 凹陷 | 硬滑 | 0.608 | 0.318 | 1 |
| 5 | 浅白 | 蜷缩 | 浊响 | 清晰 | 凹陷 | 硬滑 | 0.556 | 0.215 | 1 |
| 6 | 青绿 | 稍蜷 | 浊响 | 清晰 | 稍凹 | 软粘 | 0.403 | 0.237 | 1 |
| 7 | 乌黑 | 稍蜷 | 浊响 | 稍糊 | 稍凹 | 软粘 | 0.481 | 0.149 | 1 |
| 8 | 乌黑 | 稍蜷 | 浊响 | 清晰 | 稍凹 | 硬滑 | 0.437 | 0.211 | 1 |
| 9 | 乌黑 | 稍蜷 | 沉闷 | 稍糊 | 稍凹 | 硬滑 | 0.666 | 0.091 | 0 |
| 10 | 青绿 | 硬挺 | 清脆 | 清晰 | 平坦 | 软粘 | 0.243 | 0.267 | 0 |
| 11 | 浅白 | 硬挺 | 清脆 | 模糊 | 平坦 | 硬滑 | 0.245 | 0.057 | 0 |
| 12 | 浅白 | 蜷缩 | 浊响 | 模糊 | 平坦 | 软粘 | 0.343 | 0.099 | 0 |
| 13 | 青绿 | 稍蜷 | 浊响 | 稍糊 | 凹陷 | 硬滑 | 0.639 | 0.161 | 0 |
| 14 | 浅白 | 稍蜷 | 沉闷 | 稍糊 | 凹陷 | 硬滑 | 0.657 | 0.198 | 0 |
| 15 | 乌黑 | 稍蜷 | 浊响 | 清晰 | 稍凹 | 软粘 | 0.36 | 0.37 | 0 |
| 16 | 浅白 | 蜷缩 | 浊响 | 模糊 | 平坦 | 硬滑 | 0.593 | 0.042 | 0 |
| 17 | 青绿 | 蜷缩 | 沉闷 | 稍糊 | 稍凹 | 硬滑 | 0.719 | 0.103 | 0 |
| Idx | color | root | knocks | texture | navel | touch | density | sugar_ratio | label |
| 1 | dark_green | curl_up | little_heavily | distinct | sinking | hard_smooth | 0.697 | 0.46 | 1 |
| 2 | black | curl_up | heavily | distinct | sinking | hard_smooth | 0.774 | 0.376 | 1 |
| 3 | black | curl_up | little_heavily | distinct | sinking | hard_smooth | 0.634 | 0.264 | 1 |
| 4 | dark_green | curl_up | heavily | distinct | sinking | hard_smooth | 0.608 | 0.318 | 1 |
| 5 | light_white | curl_up | little_heavily | distinct | sinking | hard_smooth | 0.556 | 0.215 | 1 |
| 6 | dark_green | little_curl_up | little_heavily | distinct | little_sinking | soft_stick | 0.403 | 0.237 | 1 |
| 7 | black | little_curl_up | little_heavily | little_blur | little_sinking | soft_stick | 0.481 | 0.149 | 1 |
| 8 | black | little_curl_up | little_heavily | distinct | little_sinking | hard_smooth | 0.437 | 0.211 | 1 |
| 9 | black | little_curl_up | heavily | little_blur | little_sinking | hard_smooth | 0.666 | 0.091 | 0 |
| 10 | dark_green | stiff | clear | distinct | even | soft_stick | 0.243 | 0.267 | 0 |
| 11 | light_white | stiff | clear | blur | even | hard_smooth | 0.245 | 0.057 | 0 |
| 12 | light_white | curl_up | little_heavily | blur | even | soft_stick | 0.343 | 0.099 | 0 |
| 13 | dark_green | little_curl_up | little_heavily | little_blur | sinking | hard_smooth | 0.639 | 0.161 | 0 |
| 14 | light_white | little_curl_up | heavily | little_blur | sinking | hard_smooth | 0.657 | 0.198 | 0 |
| 15 | black | little_curl_up | little_heavily | distinct | little_sinking | soft_stick | 0.36 | 0.37 | 0 |
| 16 | light_white | curl_up | little_heavily | blur | even | hard_smooth | 0.593 | 0.042 | 0 |
| 17 | dark_green | curl_up | heavily | little_blur | little_sinking | hard_smooth | 0.719 | 0.103 | 0 |
- # -*- coding: utf-8 -*-
- from numpy import *
- import numpy as np
- import pandas as pd
- from math import log
- import operator
- #计算数据集的香农熵
- def calcShannonEnt(dataSet):
- numEntries=len(dataSet)
- labelCounts={}
- #给所有可能分类创建字典
- for featVec in dataSet:
- currentLabel=featVec[-1]
- if currentLabel not in labelCounts.keys():
- labelCounts[currentLabel]=0
- labelCounts[currentLabel]+=1
- shannonEnt=0.0
- #以2为底数计算香农熵
- for key in labelCounts:
- prob = float(labelCounts[key])/numEntries
- shannonEnt-=prob*log(prob,2)
- return shannonEnt
- #对离散变量划分数据集,取出该特征取值为value的所有样本
- def splitDataSet(dataSet,axis,value):
- retDataSet=[]
- for featVec in dataSet:
- if featVec[axis]==value:
- reducedFeatVec=featVec[:axis]
- reducedFeatVec.extend(featVec[axis+1:])
- retDataSet.append(reducedFeatVec)
- return retDataSet
- #对连续变量划分数据集,direction规定划分的方向,
- #决定是划分出小于value的数据样本还是大于value的数据样本集
- def splitContinuousDataSet(dataSet,axis,value,direction):
- retDataSet=[]
- for featVec in dataSet:
- if direction==0:
- if featVec[axis]>value:
- reducedFeatVec=featVec[:axis]
- reducedFeatVec.extend(featVec[axis+1:])
- retDataSet.append(reducedFeatVec)
- else:
- if featVec[axis]<=value:
- reducedFeatVec=featVec[:axis]
- reducedFeatVec.extend(featVec[axis+1:])
- retDataSet.append(reducedFeatVec)
- return retDataSet
- #选择最好的数据集划分方式
- def chooseBestFeatureToSplit(dataSet,labels):
- numFeatures=len(dataSet[0])-1
- baseEntropy=calcShannonEnt(dataSet)
- bestInfoGain=0.0
- bestFeature=-1
- bestSplitDict={}
- for i in range(numFeatures):
- featList=[example[i] for example in dataSet]
- #对连续型特征进行处理
- if type(featList[0]).__name__=='float' or type(featList[0]).__name__=='int':
- #产生n-1个候选划分点
- sortfeatList=sorted(featList)
- splitList=[]
- for j in range(len(sortfeatList)-1):
- splitList.append((sortfeatList[j]+sortfeatList[j+1])/2.0)
- bestSplitEntropy=10000
- slen=len(splitList)
- #求用第j个候选划分点划分时,得到的信息熵,并记录最佳划分点
- for j in range(slen):
- value=splitList[j]
- newEntropy=0.0
- subDataSet0=splitContinuousDataSet(dataSet,i,value,0)
- subDataSet1=splitContinuousDataSet(dataSet,i,value,1)
- prob0=len(subDataSet0)/float(len(dataSet))
- newEntropy+=prob0*calcShannonEnt(subDataSet0)
- prob1=len(subDataSet1)/float(len(dataSet))
- newEntropy+=prob1*calcShannonEnt(subDataSet1)
- if newEntropy
- bestSplitEntropy=newEntropy
- bestSplit=j
- #用字典记录当前特征的最佳划分点
- bestSplitDict[labels[i]]=splitList[bestSplit]
- infoGain=baseEntropy-bestSplitEntropy
- #对离散型特征进行处理
- else:
- uniqueVals=set(featList)
- newEntropy=0.0
- #计算该特征下每种划分的信息熵
- for value in uniqueVals:
- subDataSet=splitDataSet(dataSet,i,value)
- prob=len(subDataSet)/float(len(dataSet))
- newEntropy+=prob*calcShannonEnt(subDataSet)
- infoGain=baseEntropy-newEntropy
- if infoGain>bestInfoGain:
- bestInfoGain=infoGain
- bestFeature=i
- #若当前节点的最佳划分特征为连续特征,则将其以之前记录的划分点为界进行二值化处理
- #即是否小于等于bestSplitValue
- if type(dataSet[0][bestFeature]).__name__=='float' or type(dataSet[0][bestFeature]).__name__=='int':
- bestSplitValue=bestSplitDict[labels[bestFeature]]
- labels[bestFeature]=labels[bestFeature]+'<='+str(bestSplitValue)
- for i in range(shape(dataSet)[0]):
- if dataSet[i][bestFeature]<=bestSplitValue:
- dataSet[i][bestFeature]=1
- else:
- dataSet[i][bestFeature]=0
- return bestFeature
- #特征若已经划分完,节点下的样本还没有统一取值,则需要进行投票
- def majorityCnt(classList):
- classCount={}
- for vote in classList:
- if vote not in classCount.keys():
- classCount[vote]=0
- classCount[vote]+=1
- return max(classCount)
- #主程序,递归产生决策树
- def createTree(dataSet,labels,data_full,labels_full):
- classList=[example[-1] for example in dataSet]
- if classList.count(classList[0])==len(classList):
- return classList[0]
- if len(dataSet[0])==1:
- return majorityCnt(classList)
- bestFeat=chooseBestFeatureToSplit(dataSet,labels)
- bestFeatLabel=labels[bestFeat]
- myTree={bestFeatLabel:{}}
- featValues=[example[bestFeat] for example in dataSet]
- uniqueVals=set(featValues)
- if type(dataSet[0][bestFeat]).__name__=='str':
- currentlabel=labels_full.index(labels[bestFeat])
- featValuesFull=[example[currentlabel] for example in data_full]
- uniqueValsFull=set(featValuesFull)
- del(labels[bestFeat])
- #针对bestFeat的每个取值,划分出一个子树。
- for value in uniqueVals:
- subLabels=labels[:]
- if type(dataSet[0][bestFeat]).__name__=='str':
- uniqueValsFull.remove(value)
- myTree[bestFeatLabel][value]=createTree(splitDataSet\
- (dataSet,bestFeat,value),subLabels,data_full,labels_full)
- if type(dataSet[0][bestFeat]).__name__=='str':
- for value in uniqueValsFull:
- myTree[bestFeatLabel][value]=majorityCnt(classList)
- return myTree
# -*- coding: utf-8 -*-

from numpy import *
import numpy as np
import pandas as pd
from math import log
import operator


#计算数据集的香农熵
def calcShannonEnt(dataSet):
    numEntries=len(dataSet)
    labelCounts={}
    #给所有可能分类创建字典
    for featVec in dataSet:
        currentLabel=featVec[-1]
        if currentLabel not in labelCounts.keys():
            labelCounts[currentLabel]=0
        labelCounts[currentLabel]+=1
    shannonEnt=0.0
    #以2为底数计算香农熵
    for key in labelCounts:
        prob = float(labelCounts[key])/numEntries
        shannonEnt-=prob*log(prob,2)
    return shannonEnt


#对离散变量划分数据集,取出该特征取值为value的所有样本
def splitDataSet(dataSet,axis,value):
    retDataSet=[]
    for featVec in dataSet:
        if featVec[axis]==value:
            reducedFeatVec=featVec[:axis]
            reducedFeatVec.extend(featVec[axis+1:])
            retDataSet.append(reducedFeatVec)
    return retDataSet

#对连续变量划分数据集,direction规定划分的方向,
#决定是划分出小于value的数据样本还是大于value的数据样本集
def splitContinuousDataSet(dataSet,axis,value,direction):
    retDataSet=[]
    for featVec in dataSet:
        if direction==0:
            if featVec[axis]>value:
                reducedFeatVec=featVec[:axis]
                reducedFeatVec.extend(featVec[axis+1:])
                retDataSet.append(reducedFeatVec)
        else:
            if featVec[axis]<=value:
                reducedFeatVec=featVec[:axis]
                reducedFeatVec.extend(featVec[axis+1:])
                retDataSet.append(reducedFeatVec)
    return retDataSet

#选择最好的数据集划分方式
def chooseBestFeatureToSplit(dataSet,labels):
    numFeatures=len(dataSet[0])-1
    baseEntropy=calcShannonEnt(dataSet)
    bestInfoGain=0.0
    bestFeature=-1
    bestSplitDict={}
    for i in range(numFeatures):
        featList=[example[i] for example in dataSet]
        #对连续型特征进行处理
        if type(featList[0]).__name__=='float' or type(featList[0]).__name__=='int':
            #产生n-1个候选划分点
            sortfeatList=sorted(featList)
            splitList=[]
            for j in range(len(sortfeatList)-1):
                splitList.append((sortfeatList[j]+sortfeatList[j+1])/2.0)

            bestSplitEntropy=10000
            slen=len(splitList)
            #求用第j个候选划分点划分时,得到的信息熵,并记录最佳划分点
            for j in range(slen):
                value=splitList[j]
                newEntropy=0.0
                subDataSet0=splitContinuousDataSet(dataSet,i,value,0)
                subDataSet1=splitContinuousDataSet(dataSet,i,value,1)
                prob0=len(subDataSet0)/float(len(dataSet))
                newEntropy+=prob0*calcShannonEnt(subDataSet0)
                prob1=len(subDataSet1)/float(len(dataSet))
                newEntropy+=prob1*calcShannonEnt(subDataSet1)
                if newEntropybestInfoGain:
            bestInfoGain=infoGain
            bestFeature=i
    #若当前节点的最佳划分特征为连续特征,则将其以之前记录的划分点为界进行二值化处理
    #即是否小于等于bestSplitValue
    if type(dataSet[0][bestFeature]).__name__=='float' or type(dataSet[0][bestFeature]).__name__=='int':
        bestSplitValue=bestSplitDict[labels[bestFeature]]
        labels[bestFeature]=labels[bestFeature]+'<='+str(bestSplitValue)
        for i in range(shape(dataSet)[0]):
            if dataSet[i][bestFeature]<=bestSplitValue:
                dataSet[i][bestFeature]=1
            else:
                dataSet[i][bestFeature]=0
    return bestFeature

#特征若已经划分完,节点下的样本还没有统一取值,则需要进行投票
def majorityCnt(classList):
    classCount={}
    for vote in classList:
        if vote not in classCount.keys():
            classCount[vote]=0
        classCount[vote]+=1
    return max(classCount)

#主程序,递归产生决策树
def createTree(dataSet,labels,data_full,labels_full):
    classList=[example[-1] for example in dataSet]
    if classList.count(classList[0])==len(classList):
        return classList[0]
    if len(dataSet[0])==1:
        return majorityCnt(classList)
    bestFeat=chooseBestFeatureToSplit(dataSet,labels)
    bestFeatLabel=labels[bestFeat]
    myTree={bestFeatLabel:{}}
    featValues=[example[bestFeat] for example in dataSet]
    uniqueVals=set(featValues)
    if type(dataSet[0][bestFeat]).__name__=='str':
        currentlabel=labels_full.index(labels[bestFeat])
        featValuesFull=[example[currentlabel] for example in data_full]
        uniqueValsFull=set(featValuesFull)
    del(labels[bestFeat])
    #针对bestFeat的每个取值,划分出一个子树。
    for value in uniqueVals:
        subLabels=labels[:]
        if type(dataSet[0][bestFeat]).__name__=='str':
            uniqueValsFull.remove(value)
        myTree[bestFeatLabel][value]=createTree(splitDataSet\
         (dataSet,bestFeat,value),subLabels,data_full,labels_full)
    if type(dataSet[0][bestFeat]).__name__=='str':
        for value in uniqueValsFull:
            myTree[bestFeatLabel][value]=majorityCnt(classList)
    return myTree
通过以下语句进行调用:
- df=pd.read_csv('watermelon_4_3.csv')
- data=df.values[:,1:].tolist()
- data_full=data[:]
- labels=df.columns.values[1:-1].tolist()
- labels_full=labels[:]
- myTree=createTree(data,labels,data_full,labels_full)
df=pd.read_csv('watermelon_4_3.csv')
data=df.values[:,1:].tolist()
data_full=data[:]
labels=df.columns.values[1:-1].tolist()
labels_full=labels[:]
myTree=createTree(data,labels,data_full,labels_full)
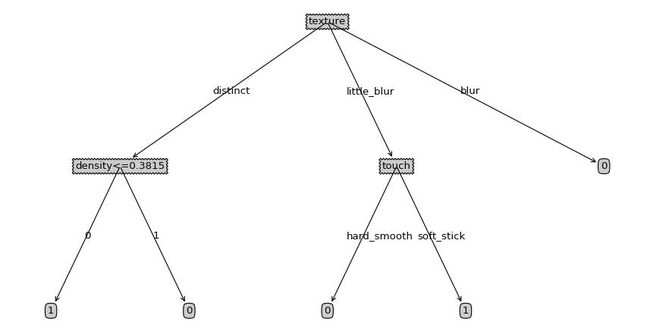
可以得到以下结果
{'texture': {'distinct': {'density<=0.3815': {0: 1L, 1: 0L}}, 'little_blur': {'touch': {'hard_smooth': 0L, 'soft_stick': 1L}}, 'blur': 0L}}
- import matplotlib.pyplot as plt
- decisionNode=dict(boxstyle="sawtooth",fc="0.8")
- leafNode=dict(boxstyle="round4",fc="0.8")
- arrow_args=dict(arrowstyle="<-")
- #计算树的叶子节点数量
- def getNumLeafs(myTree):
- numLeafs=0
- firstStr=myTree.keys()[0]
- secondDict=myTree[firstStr]
- for key in secondDict.keys():
- if type(secondDict[key]).__name__=='dict':
- numLeafs+=getNumLeafs(secondDict[key])
- else: numLeafs+=1
- return numLeafs
- #计算树的最大深度
- def getTreeDepth(myTree):
- maxDepth=0
- firstStr=myTree.keys()[0]
- secondDict=myTree[firstStr]
- for key in secondDict.keys():
- if type(secondDict[key]).__name__=='dict':
- thisDepth=1+getTreeDepth(secondDict[key])
- else: thisDepth=1
- if thisDepth>maxDepth:
- maxDepth=thisDepth
- return maxDepth
- #画节点
- def plotNode(nodeTxt,centerPt,parentPt,nodeType):
- createPlot.ax1.annotate(nodeTxt,xy=parentPt,xycoords='axes fraction',\
- xytext=centerPt,textcoords='axes fraction',va="center", ha="center",\
- bbox=nodeType,arrowprops=arrow_args)
- #画箭头上的文字
- def plotMidText(cntrPt,parentPt,txtString):
- lens=len(txtString)
- xMid=(parentPt[0]+cntrPt[0])/2.0-lens*0.002
- yMid=(parentPt[1]+cntrPt[1])/2.0
- createPlot.ax1.text(xMid,yMid,txtString)
- def plotTree(myTree,parentPt,nodeTxt):
- numLeafs=getNumLeafs(myTree)
- depth=getTreeDepth(myTree)
- firstStr=myTree.keys()[0]
- cntrPt=(plotTree.x0ff+(1.0+float(numLeafs))/2.0/plotTree.totalW,plotTree.y0ff)
- plotMidText(cntrPt,parentPt,nodeTxt)
- plotNode(firstStr,cntrPt,parentPt,decisionNode)
- secondDict=myTree[firstStr]
- plotTree.y0ff=plotTree.y0ff-1.0/plotTree.totalD
- for key in secondDict.keys():
- if type(secondDict[key]).__name__=='dict':
- plotTree(secondDict[key],cntrPt,str(key))
- else:
- plotTree.x0ff=plotTree.x0ff+1.0/plotTree.totalW
- plotNode(secondDict[key],(plotTree.x0ff,plotTree.y0ff),cntrPt,leafNode)
- plotMidText((plotTree.x0ff,plotTree.y0ff),cntrPt,str(key))
- plotTree.y0ff=plotTree.y0ff+1.0/plotTree.totalD
- def createPlot(inTree):
- fig=plt.figure(1,facecolor='white')
- fig.clf()
- axprops=dict(xticks=[],yticks=[])
- createPlot.ax1=plt.subplot(111,frameon=False,**axprops)
- plotTree.totalW=float(getNumLeafs(inTree))
- plotTree.totalD=float(getTreeDepth(inTree))
- plotTree.x0ff=-0.5/plotTree.totalW
- plotTree.y0ff=1.0
- plotTree(inTree,(0.5,1.0),'')
- plt.show()
import matplotlib.pyplot as plt
decisionNode=dict(boxstyle="sawtooth",fc="0.8")
leafNode=dict(boxstyle="round4",fc="0.8")
arrow_args=dict(arrowstyle="<-")


#计算树的叶子节点数量
def getNumLeafs(myTree):
    numLeafs=0
    firstStr=myTree.keys()[0]
    secondDict=myTree[firstStr]
    for key in secondDict.keys():
        if type(secondDict[key]).__name__=='dict':
            numLeafs+=getNumLeafs(secondDict[key])
        else: numLeafs+=1
    return numLeafs

#计算树的最大深度
def getTreeDepth(myTree):
    maxDepth=0
    firstStr=myTree.keys()[0]
    secondDict=myTree[firstStr]
    for key in secondDict.keys():
        if type(secondDict[key]).__name__=='dict':
            thisDepth=1+getTreeDepth(secondDict[key])
        else: thisDepth=1
        if thisDepth>maxDepth:
            maxDepth=thisDepth
    return maxDepth

#画节点
def plotNode(nodeTxt,centerPt,parentPt,nodeType):
    createPlot.ax1.annotate(nodeTxt,xy=parentPt,xycoords='axes fraction',\
    xytext=centerPt,textcoords='axes fraction',va="center", ha="center",\
    bbox=nodeType,arrowprops=arrow_args)

#画箭头上的文字
def plotMidText(cntrPt,parentPt,txtString):
    lens=len(txtString)
    xMid=(parentPt[0]+cntrPt[0])/2.0-lens*0.002
    yMid=(parentPt[1]+cntrPt[1])/2.0
    createPlot.ax1.text(xMid,yMid,txtString)

def plotTree(myTree,parentPt,nodeTxt):
    numLeafs=getNumLeafs(myTree)
    depth=getTreeDepth(myTree)
    firstStr=myTree.keys()[0]
    cntrPt=(plotTree.x0ff+(1.0+float(numLeafs))/2.0/plotTree.totalW,plotTree.y0ff)
    plotMidText(cntrPt,parentPt,nodeTxt)
    plotNode(firstStr,cntrPt,parentPt,decisionNode)
    secondDict=myTree[firstStr]
    plotTree.y0ff=plotTree.y0ff-1.0/plotTree.totalD
    for key in secondDict.keys():
        if type(secondDict[key]).__name__=='dict':
            plotTree(secondDict[key],cntrPt,str(key))
        else:
            plotTree.x0ff=plotTree.x0ff+1.0/plotTree.totalW
            plotNode(secondDict[key],(plotTree.x0ff,plotTree.y0ff),cntrPt,leafNode)
            plotMidText((plotTree.x0ff,plotTree.y0ff),cntrPt,str(key))
    plotTree.y0ff=plotTree.y0ff+1.0/plotTree.totalD

def createPlot(inTree):
    fig=plt.figure(1,facecolor='white')
    fig.clf()
    axprops=dict(xticks=[],yticks=[])
    createPlot.ax1=plt.subplot(111,frameon=False,**axprops)
    plotTree.totalW=float(getNumLeafs(inTree))
    plotTree.totalD=float(getTreeDepth(inTree))
    plotTree.x0ff=-0.5/plotTree.totalW
    plotTree.y0ff=1.0
    plotTree(inTree,(0.5,1.0),'')
    plt.show()
调用方式为
- createPlot(myTree)
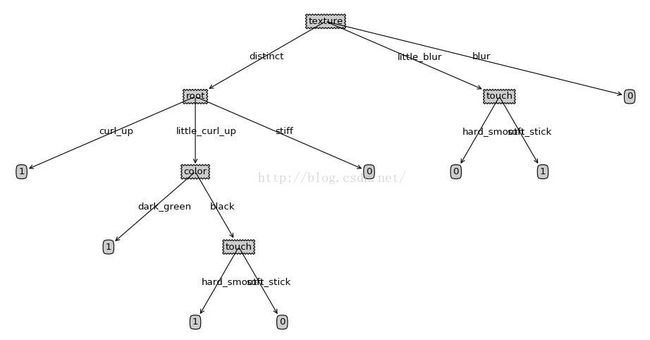
createPlot(myTree)以上的决策树计算代码以及画图代码可以放在不同的文件中进行调用,也可以直接放在一个py文件中。
- #主程序,递归产生决策树
- def createTree(dataSet,labels):
- classList=[example[-1] for example in dataSet]
- if classList.count(classList[0])==len(classList):
- return classList[0]
- if len(dataSet[0])==1:
- return majorityCnt(classList)
- bestFeat=chooseBestFeatureToSplit(dataSet,labels)
- bestFeatLabel=labels[bestFeat]
- myTree={bestFeatLabel:{}}
- del(labels[bestFeat])
- featValues=[example[bestFeat] for example in dataSet]
- uniqueVals=set(featValues)
- #针对bestFeat的每个取值,划分出一个子树。
- for value in uniqueVals:
- subLabels=labels[:]
- myTree[bestFeatLabel][value]=createTree(splitDataSet\
- (dataSet,bestFeat,value),subLabels)
- return myTree
#主程序,递归产生决策树
def createTree(dataSet,labels):
    classList=[example[-1] for example in dataSet]
    if classList.count(classList[0])==len(classList):
        return classList[0]
    if len(dataSet[0])==1:
        return majorityCnt(classList)
    bestFeat=chooseBestFeatureToSplit(dataSet,labels)
    bestFeatLabel=labels[bestFeat]
    myTree={bestFeatLabel:{}}
    del(labels[bestFeat])
    featValues=[example[bestFeat] for example in dataSet]
    uniqueVals=set(featValues)
    #针对bestFeat的每个取值,划分出一个子树。
    for value in uniqueVals:
        subLabels=labels[:]
        myTree[bestFeatLabel][value]=createTree(splitDataSet\
         (dataSet,bestFeat,value),subLabels)
return myTree 

