【Lane Detection】车道线检测的简单实现 (OpenCV)
目录
1 导入工具库,查看图片
2 图片灰度处理
3 Canny边缘检测
4 划定ROI
5 霍夫变换,直线检测
6 直线拟合,根据端点画出左右 lane
7 Pipeline搭建 & Video车道检测
8 方法改进
8.1 分别提取yellow pixels(HSV) & white pixels
8.2 高斯模糊(减小噪声)
8.3 ROI 由三角形,改进为上窄下宽的梯形
8.4 直线拟合:采用平均斜率和平均点来确定近似直线
8.5 Pipeline and results
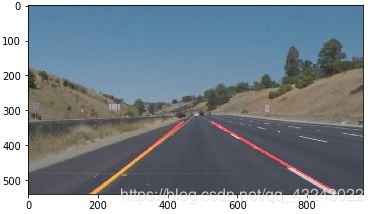
利用OpenCV工具库,采用一些图像处理方法,实现车道线的简单检测。
用到的cv库函数:
cv2.fillPoly()for regions selectioncv2.line()to draw lines on an image given endpointscv2.addWeighted()to coadd / overlay two imagescv2.cvtColor()to grayscale or change colorcv2.bitwise_and()to apply a mask to an image
思路:
- Grayscale将图片灰度化(方便后续的边缘检测)
- Canny Edge Detection边缘检测(Canny 边缘检测,检测出边缘像素点)
- Hough Transform 霍夫变换(检测边缘像素点的可能直线)
- Group Left and Right Lines 根据直线斜率将霍夫变换检测出的直线分组:left or right
- Fit and Draw 将左右两组的线分别拟合为一条线,并设定 y_bottom 和y_top,根据拟合方程分别求出left和right的 x_bottom和x_top,完成检测,左线:(left_x_bottom ,y_bottom,left_x_top,y_top),右线:(right_x_bottom ,y_bottom,right_x_top,y_top)
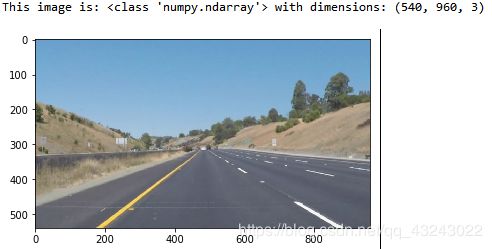
1 导入工具库,查看图片
import matplotlib.pyplot as plt
import matplotlib.image as mpimg
import numpy as np
import cv2
# reading in an image
image = mpimg.imread('whiteCarLaneSwitch.jpg')
# printing out some stats and plotting the image
print('This image is:', type(image), 'with dimensions:', image.shape)
plt.imshow(image)
plt.show()
2 图片灰度处理
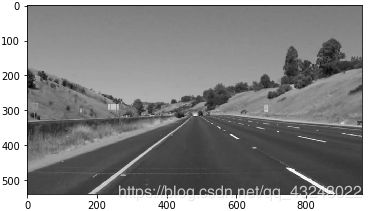
读入的图像是RGB格式,channel=3,后续进行边缘检测时只关注color的强度变化,对于color是什么并不会影响检测结果。所以先将图像灰度化,作为后续边缘检测的预处理。
灰度化的结果是只有一个通道的图像,但是如果要查看灰度图片,需要 plt.imshow(gray_img,cmap='gray')。
def grayscale(img):
        """
        将图像灰度化,作为后续边缘检测的预处理
        """
        return cv2.cvtColor(img,cv2.COLOR_RGB2GRAY)
gray_img=grayscale(image)
plt.imshow(gray_img)
3 Canny边缘检测
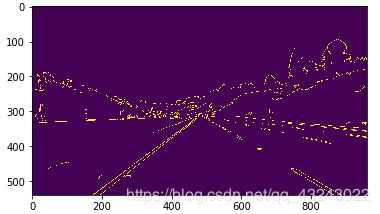
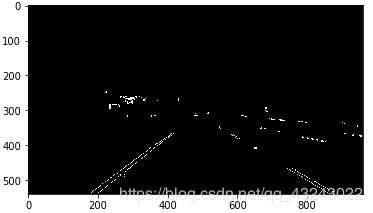
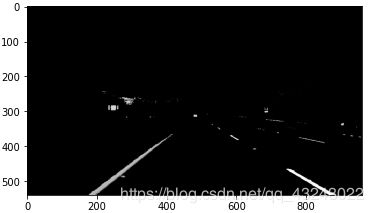
边缘检测的目的,是检测出最类似边缘的像素点,其结果是一些pixels。这些pixels的特点是,像素值变化大,也就是梯度较大。Canny边缘检测基于x y方向的像素梯度来实现检测。
cv2.Canny(img,low_threshold,high_threshold):
大于 high_threshold: edge;
小于 low_threshold: not edge;
中间值(low_threshold, high_threshold):若与edge相连,则认为是edge,不相连则 not edge
def canny(img,low_threshold=100,high_threshold=200):
        """
        input是经过灰度处理的灰度图像,不关注颜色,只关注颜色强度
        边缘检测,原理:计算颜色值的梯度和方向,找到梯度变化较大的像素
        >high_threshold: edge
4 划定ROI
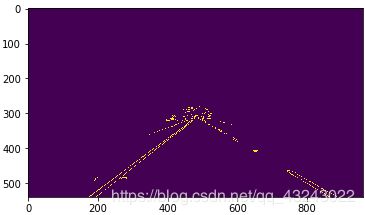
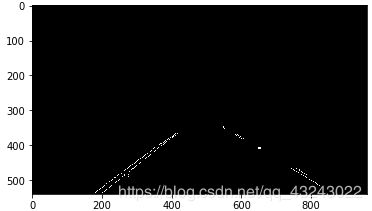
根据行车记录仪图像特点,我们将目标区域缩小为一个三角形(底边在bottom上,顶点大约在图像中心位置),划定该区域为ROI(Region of Interests),将其他区域里的目标进行遮挡(mask 掩膜操作)。
def region_of_interest(img):
        """
        分割出ROI,并填充,再对图像掩膜处理,将其他object遮挡
        """
        #draw the polygon with three vertices
        height=img.shape[0]
        width=img.shape[1]
        region_of_interest_vertices = [
        (0, height),
        (width / 2, height / 2),
        (width, height)]
        # Define a blank matrix that matches the image height/width.
        mask = np.zeros_like(img)
        # Retrieve the number of color channels of the image.
        #channel_count = img.shape[2]
        # Create a match color with the same color channel counts.
        #match_mask_color = (255,) * channel_count #彩色图像时的color
        match_mask_color = 255
        # Fill inside the polygon
        #cv2.fillPoly(mask, np.array([region_of_interest_vertices],np.int32),match_mask_color)#多边形填充
        cv2.fillPoly(mask, np.array([region_of_interest_vertices],np.int32), match_mask_color)
        #按位与操作,对图片进行mask淹膜操作,ROI区域正常显示,其他区域置零
        masked_image = cv2.bitwise_and(img, mask)
        return masked_image
ROI_img=region_of_interest(canny_img)
plt.imshow(ROI_img)
5 霍夫变换,直线检测
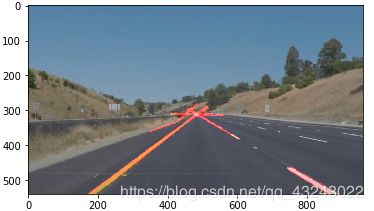
Canny 边缘检测结果,只是一些类似边缘的pixels,利用霍夫变换求出其中可能存在的直线。霍夫变换的原理:将该点映射到霍夫空间(r θ坐标系),该空间的每条线都代表过图像空间中一点的所有直线集合,求空间里线与线的交点,即为图像空间的过某几个点的直线。霍夫变换的结果是多条直线的坐标[ [x1,y1,x2,y2], [x x y y]...]
可以看到,霍夫变换的结果中线可能是不连续的,是由多条线组成的。
def hough_lines(img,rho=6,theta=np.pi/180,threshold=160,
                    min_line_len=40,max_line_gap=25):
        """
        将canny边缘检测后的像素点连接成线,并调用划线函数,返回画线的图片
        hough transform原理:转换到 hough space,r,θ极坐标,正弦曲线,
        每条线代表个image space中过一点的所有线,
        lines的交点代表共线,找到交点再返回到image space空间
        lines:[[x1,y1,x2,y2],[x x y y]...]
        """
        lines=cv2.HoughLinesP(img,rho,theta,threshold, np.array([]),
                              minLineLength=min_line_len, maxLineGap=max_line_gap)
        return lines

def draw_lines(img,lines,color=[255,0,0],thickness=3):
        """
        生成一个zeros图划线,并与原图混合
        """
        if lines is None:
            return
        img=np.copy(img)
        #生成待划线的图,zeros,addweighted混合的时候,0值不会显示
        img_channels=img.shape[2]
        line_img=np.zeros((img.shape[0],img.shape[1],img_channels),dtype=np.uint8)
        for line in lines:
            for x1,y1,x2,y2 in line:
                cv2.line(line_img,(x1,y1),(x2,y2),color,thickness)
        #将划线图与原图合并
        #cv2.addWeighted(initial_img, α, img, β , γ)
        #output: initial_img * α + img * β + γ
        img=cv2.addWeighted(img, 0.8, line_img, 1.0, 0.0) #叠加的两幅图片尺寸和channel需要一致
        return img

lines=hough_lines(ROI_img)
line_img=draw_lines(image,lines)
plt.imshow(line_img)
6 直线拟合,根据端点画出左右 lane
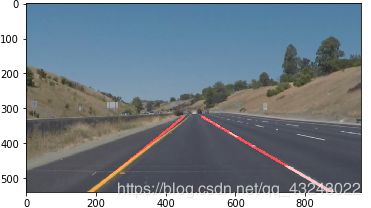
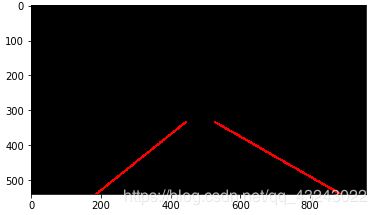
Hough 变换的结果是不理想的,因为存在不连续性。所以可以根据这些线的斜率,将这些端点划分为左右两组。分别求出拟合直线,再根据设定的y_top和y_bottom,求出端点的x_top,x_bottom,完美解决!
根据斜率划分左右组:原点在左上角,所以斜率大于0属于right,小于0属于left。绝对值小于0.5的直接舍去,减小噪声影响。
def group_lines_and_draw(img,lines):
        """
        根据斜率,将所有的线分为左右两组,斜率绝对值小于0.5的舍去(影响不显著)
        (因为图像的原点在左上角,slope<0是left lines,slope>0是right lines)
        设定min_y作为left和right的top线,max_y为bottom线,求出四个x值即可确定直线:
        将left和right的点分别线性拟合,拟合方程根据y值,求出x值,画出lane
        """
        left_x,left_y,right_x,right_y=[],[],[],[]
        for line in lines:
            for x1,y1,x2,y2 in line:
                slope=(y2-y1)/(x2-x1)
                if abs(slope)<0.5: continue
                if slope<0:
                    left_x.extend([x1,x2])
                    left_y.extend([y1,y2])
                if slope>0:
                    right_x.extend([x1,x2])
                    right_y.extend([y1,y2])
        #设定top 和 bottom的y值,left和right的y值都一样
        min_y=int(img.shape[0]*(3/5))
        max_y=int(img.shape[0])

        #对left的所有点进行线性拟合
        poly_left = np.poly1d(np.polyfit(left_y,left_x,deg=1))
        left_x_start = int(poly_left(max_y))
        left_x_end = int(poly_left(min_y))
        #对right的所有点进行线性拟合
        poly_right = np.poly1d(np.polyfit(right_y,right_x,deg=1))
        right_x_start = int(poly_right(max_y))
        right_x_end = int(poly_right(min_y))

        line_image=draw_lines(img,[[
                [left_x_start,max_y,left_x_end,min_y],
                [right_x_start,max_y,right_x_end,min_y],
                ]],thickness=5)
        return line_image

final_image=group_lines_and_draw(image,lines)
plt.imshow(final_image7 Pipeline搭建 & Video车道检测
先把上述图片中车道检测的操作搭建 pipeline,利用moviepy工具库,读取video,对视频中的每一帧都执行上述图片操作。
(anaconda 安装时如果提示channel中没有相应工具,可以添加工具检索库:conda config --append channels conda-forge,检索更全面)
搭建图片车道检测检测的pipeline(此处要返回图片,且图片的通道数和video里的一致)
import matplotlib.pyplot as plt
import matplotlib.image as mpimg
import numpy as np
import cv2

def lane_img_pipeline(image):
    #import matplotlib.pyplot as plt
    #import matplotlib.image as mpimg
    #import numpy as np
    #import cv2
    def grayscale(img):
        """
        将图像灰度化,作为后续边缘检测的预处理
        """
        return cv2.cvtColor(img,cv2.COLOR_RGB2GRAY)

    def canny(img,low_threshold=100,high_threshold=200):
        """
        input是经过灰度处理的灰度图像,不关注颜色,只关注颜色强度
        边缘检测,原理:计算颜色值的梯度和方向,找到梯度变化较大的像素
        >high_threshold: edge
        0是right lines)
        设定min_y作为left和right的top线,max_y为bottom线,求出四个x值即可确定直线:
        将left和right的点分别线性拟合,拟合方程根据y值,求出x值,画出lane
        """
        left_x,left_y,right_x,right_y=[],[],[],[]
        for line in lines:
            for x1,y1,x2,y2 in line:
                slope=(y2-y1)/(x2-x1)
                #if abs(slope)<0.5: continue
                if slope<0:
                    left_x.extend([x1,x2])
                    left_y.extend([y1,y2])
                if slope>0:
                    right_x.extend([x1,x2])
                    right_y.extend([y1,y2])
        #设定top 和 bottom的y值,left和right的y值都一样
        min_y=int(img.shape[0]*(3/5))
        max_y=int(img.shape[0])

        #对left的所有点进行线性拟合
        poly_left = np.poly1d(np.polyfit(left_y,left_x,deg=1))
        left_x_start = int(poly_left(max_y))
        left_x_end = int(poly_left(min_y))
        #对right的所有点进行线性拟合
        poly_right = np.poly1d(np.polyfit(right_y,right_x,deg=1))
        right_x_start = int(poly_right(max_y))
        right_x_end = int(poly_right(min_y))

        line_image=draw_lines(img,[[
                [left_x_start,max_y,left_x_end,min_y],
                [right_x_start,max_y,right_x_end,min_y],
                ]],thickness=5)
        return line_image

    """
    函数调用并生成final image
    """
    gray_img=grayscale(image)
    #plt.imshow(gray_img)

    canny_img=canny(gray_img)
    #plt.imshow(canny_img)
    ROI_img=region_of_interest(canny_img)
    #plt.imshow(ROI_img)

    lines=hough_lines(ROI_img)
    line_img=draw_lines(image,lines)
    #plt.imshow(line_img)

    final_image=group_lines_and_draw(image,lines)
    #plt.imshow(final_image)

    return final_image
Video 车道检测
#视频lane detection
from moviepy.editor import VideoFileClip
from IPython.display import HTML
white_output='solidWhiteRight_output.mp4' #output文件名
clip1=VideoFileClip('solidWhiteRight.mp4') #读入input video
print(clip1.fps) #frames per second 25, 默认传给write
white_clip=clip1.fl_image(lane_img_pipeline) #对每一帧都执行lane_img_pipeline函数,函数返回的是操作后的image
white_clip.write_videofile(white_output,audio=False) #输出经过处理后的每一帧图片,audio=false,不输出音频

#ipython jupyter notebook网页显示video
HTML("""


""".format(white_output))
8 方法改进
8.1 分别提取yellow pixels(HSV) & white pixels
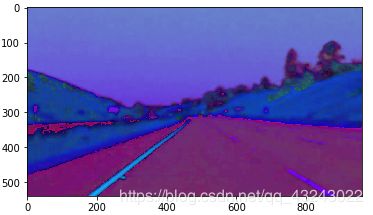
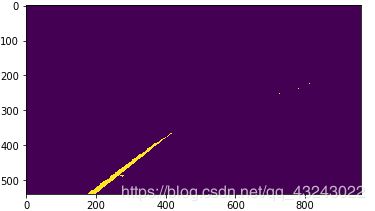
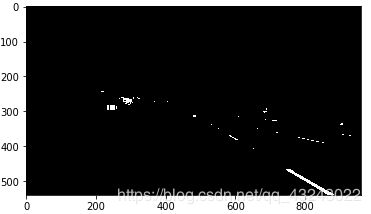
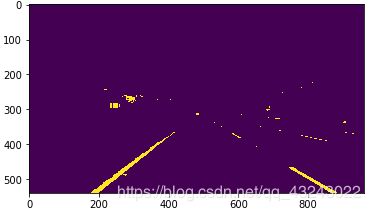
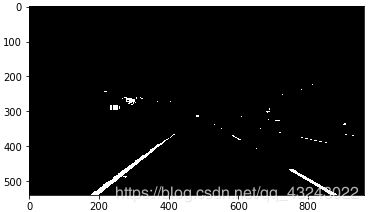
灰度化过程中,利用HSV空间提取yellow pixels,灰度空间提取while pixels,得到的灰度图片噪声更少,更清晰准确。
cv2.inRange(img,lower,upper):
upper的像素点都置零,位于中间的置为255
img_hsv = cv2.cvtColor(image, cv2.COLOR_RGB2HSV)
img_hsv = cv2.cvtColor(image, cv2.COLOR_RGB2HSV)
plt.imshow(img_hsv)

#在HSV空间对yellow pixels提取,掩膜操作
lower_yellow = np.array([20, 100, 100], dtype = "uint8")
upper_yellow = np.array([30, 255, 255], dtype="uint8")

#cv2.inRange,upper的像素点都置零,位于中间的置为255
mask_yellow = cv2.inRange(img_hsv, lower_yellow, upper_yellow)
plt.imshow(mask_yellow)

#在gray空间对white pixels提取,掩膜操作
mask_white = cv2.inRange(gray_image, 200, 255)
plt.imshow(mask_white,cmap='gray')

#或操作,将yellow与white合并
mask_yw = cv2.bitwise_or(mask_white, mask_yellow)
plt.imshow(mask_yw,cmap='gray')

#与操作,将灰度图像淹膜处理,mask_yw以外的区域置零
mask_yw_image = cv2.bitwise_and(gray_image, mask_yw)
plt.imshow(mask_yw_image,cmap='gray')
8.2 高斯模糊(减小噪声)
对 kernel 内的像素均值滤波
#高斯模糊(去噪)
kernel_size = 5
gauss_gray = gaussian_blur(mask_yw_image,kernel_size)
plt.imshow(gauss_gray,cmap='gray')

#Canny边缘检测
low_threshold = 50
high_threshold = 150
canny_edges = canny(gauss_gray,low_threshold,high_threshold)
plt.imshow(canny_edges,cmap='gray')
8.3 ROI 由三角形,改进为上窄下宽的梯形
由三角形改为梯形,更贴合实际车道在图像中的位置,在弯度较大的地方,检测性能也更好。
imshape = image.shape
lower_left = [imshape[1]/9,imshape[0]]
lower_right = [imshape[1]-imshape[1]/9,imshape[0]]
top_left = [imshape[1]/2-imshape[1]/8,imshape[0]/2+imshape[0]/10]
top_right = [imshape[1]/2+imshape[1]/8,imshape[0]/2+imshape[0]/10]
vertices = [np.array([lower_left,top_left,top_right,lower_right],dtype=np.int32)]
roi_image = region_of_interest(canny_edges, vertices)
plt.imshow(roi_image,cmap='gray')
8.4 直线拟合:采用平均斜率和平均点来确定近似直线
def draw_lines(img, lines, color=[255, 0, 0], thickness=6):
    """workflow:
    1) examine each individual line returned by hough & determine if it's in left or right lane by its slope
    because we are working "upside down" with the array, the left lane will have a negative slope and right positive
    2) track extrema
    3) compute averages
    4) solve for b intercept
    5) use extrema to solve for points
    6) smooth frames and cache
    """
    global cache
    global first_frame
    y_global_min = img.shape[0] #min will be the "highest" y value, or point down the road away from car
    y_max = img.shape[0]
    l_slope, r_slope = [],[]
    l_lane,r_lane = [],[]
    det_slope = 0.4
    α =0.2
    #i got this alpha value off of the forums for the weighting between frames.
    #i understand what it does, but i dont understand where it comes from
    #much like some of the parameters in the hough function

    for line in lines:
        #1
        for x1,y1,x2,y2 in line:
            slope = get_slope(x1,y1,x2,y2)
            if slope > det_slope:
                r_slope.append(slope)
                r_lane.append(line)
            elif slope < -det_slope:
                l_slope.append(slope)
                l_lane.append(line)
        #2
        y_global_min = min(y1,y2,y_global_min) 记录y_bottom最小值

    # to prevent errors in challenge video from dividing by zero
    if((len(l_lane) == 0) or (len(r_lane) == 0)):
        print ('no lane detected')
        return 1

    #3 y=mx+b,求m,取平均值
    l_slope_mean = np.mean(l_slope,axis =0) #求left lane的平均斜率
    r_slope_mean = np.mean(r_slope,axis =0) #求right lane的平均斜率
    l_mean = np.mean(np.array(l_lane),axis=0) #求left lane的平均点(所有点的x y的均值)
    r_mean = np.mean(np.array(r_lane),axis=0) #求right lane的平均点

    if ((r_slope_mean == 0) or (l_slope_mean == 0 )):
        print('dividing by zero')
        return 1


    #4, y=mx+b -> b = y -mx 根据斜率和点,求截距
    l_b = l_mean[0][1] - (l_slope_mean * l_mean[0][0])
    r_b = r_mean[0][1] - (r_slope_mean * r_mean[0][0])

    #5, using y-extrema (#2), b intercept (#4), and slope (#3) solve for x using y=mx+b
    # x = (y-b)/m 求x_bottom 和 x_top,四个点即可确定两条直线
    # these 4 points are our two lines that we will pass to the draw function
    l_x1 = int((y_global_min - l_b)/l_slope_mean)
    l_x2 = int((y_max - l_b)/l_slope_mean)
    r_x1 = int((y_global_min - r_b)/r_slope_mean)
    r_x2 = int((y_max - r_b)/r_slope_mean)

......
8.5 pipeline and result
函数定义:
def grayscale(img):
    """Applies the Grayscale transform
    This will return an image with only one color channel
    but NOTE: to see the returned image as grayscale
    (assuming your grayscaled image is called 'gray')
    you should call plt.imshow(gray, cmap='gray')"""
    return cv2.cvtColor(img, cv2.COLOR_BGR2GRAY)

def gaussian_blur(img, kernel_size):
    """Applies a Gaussian Noise kernel"""
    return cv2.GaussianBlur(img, (kernel_size, kernel_size), 0)

def canny(img, low_threshold, high_threshold):
    """Applies the Canny transform"""
    return cv2.Canny(img, low_threshold, high_threshold)

def region_of_interest(img, vertices):
    """
    Applies an image mask.

    Only keeps the region of the image defined by the polygon
    formed from `vertices`. The rest of the image is set to black.
    """
    #defining a blank mask to start with
    mask = np.zeros_like(img)

    #defining a 3 channel or 1 channel color to fill the mask with depending on the input image
    if len(img.shape) > 2:
        channel_count = img.shape[2]  # i.e. 3 or 4 depending on your image
        ignore_mask_color = (255,) * channel_count
    else:
        ignore_mask_color = 255

    #filling pixels inside the polygon defined by "vertices" with the fill color
    cv2.fillPoly(mask, vertices, ignore_mask_color)

    #returning the image only where mask pixels are nonzero
    masked_image = cv2.bitwise_and(img, mask)
    return masked_image

def get_slope(x1,y1,x2,y2):
    return (y2-y1)/(x2-x1)

#thick red lines
def draw_lines(img, lines, color=[255, 0, 0], thickness=6):
    """workflow:
    1) examine each individual line returned by hough & determine if it's in left or right lane by its slope
    because we are working "upside down" with the array, the left lane will have a negative slope and right positive
    2) track extrema
    3) compute averages
    4) solve for b intercept
    5) use extrema to solve for points
    6) smooth frames and cache
    """
    global cache
    global first_frame
    y_global_min = img.shape[0] #min will be the "highest" y value, or point down the road away from car
    y_max = img.shape[0]
    l_slope, r_slope = [],[]
    l_lane,r_lane = [],[]
    det_slope = 0.4
    α =0.2
    #i got this alpha value off of the forums for the weighting between frames.
    #i understand what it does, but i dont understand where it comes from
    #much like some of the parameters in the hough function

    for line in lines:
        #1
        for x1,y1,x2,y2 in line:
            slope = get_slope(x1,y1,x2,y2)
            if slope > det_slope:
                r_slope.append(slope)
                r_lane.append(line)
            elif slope < -det_slope:
                l_slope.append(slope)
                l_lane.append(line)
        #2
        y_global_min = min(y1,y2,y_global_min)

    # to prevent errors in challenge video from dividing by zero
    if((len(l_lane) == 0) or (len(r_lane) == 0)):
        print ('no lane detected')
        return 1

    #3
    l_slope_mean = np.mean(l_slope,axis =0)
    r_slope_mean = np.mean(r_slope,axis =0)
    l_mean = np.mean(np.array(l_lane),axis=0)
    r_mean = np.mean(np.array(r_lane),axis=0)

    if ((r_slope_mean == 0) or (l_slope_mean == 0 )):
        print('dividing by zero')
        return 1


    #4, y=mx+b -> b = y -mx
    l_b = l_mean[0][1] - (l_slope_mean * l_mean[0][0])
    r_b = r_mean[0][1] - (r_slope_mean * r_mean[0][0])

    #5, using y-extrema (#2), b intercept (#4), and slope (#3) solve for x using y=mx+b
    # x = (y-b)/m
    # these 4 points are our two lines that we will pass to the draw function
    l_x1 = int((y_global_min - l_b)/l_slope_mean)
    l_x2 = int((y_max - l_b)/l_slope_mean)
    r_x1 = int((y_global_min - r_b)/r_slope_mean)
    r_x2 = int((y_max - r_b)/r_slope_mean)

    #6
    if l_x1 > r_x1:
        l_x1 = int((l_x1+r_x1)/2)
        r_x1 = l_x1
        l_y1 = int((l_slope_mean * l_x1 ) + l_b)
        r_y1 = int((r_slope_mean * r_x1 ) + r_b)
        l_y2 = int((l_slope_mean * l_x2 ) + l_b)
        r_y2 = int((r_slope_mean * r_x2 ) + r_b)
    else:
        l_y1 = y_global_min
        l_y2 = y_max
        r_y1 = y_global_min
        r_y2 = y_max

    current_frame = np.array([l_x1,l_y1,l_x2,l_y2,r_x1,r_y1,r_x2,r_y2],dtype ="float32")

    if first_frame == 1:
        next_frame = current_frame
        first_frame = 0
    else :
        prev_frame = cache
        next_frame = (1-α)*prev_frame+α*current_frame

    cv2.line(img, (int(next_frame[0]), int(next_frame[1])), (int(next_frame[2]),int(next_frame[3])), color, thickness)
    cv2.line(img, (int(next_frame[4]), int(next_frame[5])), (int(next_frame[6]),int(next_frame[7])), color, thickness)

    cache = next_frame


def hough_lines(img, rho, theta, threshold, min_line_len, max_line_gap):
    """
    `img` should be the output of a Canny transform.

    Returns an image with hough lines drawn.
    """
    lines = cv2.HoughLinesP(img, rho, theta, threshold, np.array([]), minLineLength=min_line_len, maxLineGap=max_line_gap)
    line_img = np.zeros((img.shape[0], img.shape[1], 3), dtype=np.uint8)
    draw_lines(line_img,lines)
    return line_img

def weighted_img(img, initial_img, α=0.8, β=1., λ=0.):
    """
    `img` is the output of the hough_lines(), An image with lines drawn on it.
    Should be a blank image (all black) with lines drawn on it.

    `initial_img` should be the image before any processing.

    The result image is computed as follows:

    initial_img * α + img * β + λ
    NOTE: initial_img and img must be the same shape!
    """
    return cv2.addWeighted(initial_img, α, img, β, λ)
pipline
import matplotlib.pyplot as plt
import matplotlib.image as mpimg
import numpy as np
import cv2
import os
from moviepy.editor import VideoFileClip
from IPython.display import HTML
import math

image = mpimg.imread('whiteCarLaneSwitch.jpg')
# printing out some stats and plotting the image
print('This image is:', type(image), 'with dimensions:', image.shape)
plt.imshow(image)
plt.show()
def lane_img_pipeline(image):
    gray_image=grayscale(image)
    plt.imshow(gray_image,cmap='gray') #cmap='gray' 才能显示灰度图像
    #转换为HSV空间,利于提取yellow lane
    img_hsv = cv2.cvtColor(image, cv2.COLOR_RGB2HSV)
    plt.imshow(img_hsv)

    lower_yellow = np.array([20, 100, 100], dtype = "uint8")
    upper_yellow = np.array([30, 255, 255], dtype="uint8")

    #cv2.inRange,upper的像素点都置零,位于中间的置为255
    mask_yellow = cv2.inRange(img_hsv, lower_yellow, upper_yellow)
    plt.imshow(mask_yellow)

    mask_white = cv2.inRange(gray_image, 200, 255)
    plt.imshow(mask_white,cmap='gray')

    #或操作,将yellow与white合并
    mask_yw = cv2.bitwise_or(mask_white, mask_yellow)
    plt.imshow(mask_yw,cmap='gray')

    #与操作,将灰度图像淹膜处理,mask_yw以外的区域置零
    mask_yw_image = cv2.bitwise_and(gray_image, mask_yw)
    plt.imshow(mask_yw_image,cmap='gray')

    #高斯模糊(去噪)
    kernel_size = 5
    gauss_gray = gaussian_blur(mask_yw_image,kernel_size)
    plt.imshow(gauss_gray,cmap='gray')

    #Canny边缘检测
    low_threshold = 50
    high_threshold = 150
    canny_edges = canny(gauss_gray,low_threshold,high_threshold)
    plt.imshow(canny_edges,cmap='gray')

    #划定ROI ,定义了一个上窄下宽梯形,顶点的坐标是笛卡尔坐标系下的
    imshape = image.shape
    lower_left = [imshape[1]/9,imshape[0]]
    lower_right = [imshape[1]-imshape[1]/9,imshape[0]]
    top_left = [imshape[1]/2-imshape[1]/8,imshape[0]/2+imshape[0]/10]
    top_right = [imshape[1]/2+imshape[1]/8,imshape[0]/2+imshape[0]/10]
    vertices = [np.array([lower_left,top_left,top_right,lower_right],dtype=np.int32)]
    roi_image = region_of_interest(canny_edges, vertices)
    plt.imshow(roi_image,cmap='gray')

    #Hough Transform
    rho = 4
    theta = np.pi/180
    #threshold is minimum number of intersections in a grid for candidate line to go to output
    threshold = 30
    min_line_len = 100
    max_line_gap = 180

    global first_frame
    line_image = hough_lines(roi_image, rho, theta, threshold, min_line_len, max_line_gap)
    plt.imshow(line_image,cmap='gray')
    result = weighted_img(line_image, image, α=0.8, β=1., λ=0.)
    plt.imshow(result)

    return result

first_frame = 1
white_output='HSV_process_solidWhiteRight_output.mp4' #output文件名
clip1=VideoFileClip('solidWhiteRight.mp4') #读入input video
print(clip1.fps) #frames per second 25, 默认传给write
white_clip=clip1.fl_image(lane_img_pipeline) #对每一帧都执行lane_img_pipeline函数,函数返回的是操作后的image
white_clip.write_videofile(white_output,audio=False) 与原方法对比,可以明显看出车道线的波动变小,检测更加稳定。精度方面的差别很难辨识。
参考:
Simple Lane Detection with OpenCV
Udacity: Lane Finding Project for Self-Driving Car ND
Building a lane detection system using Python 3 and OpenCV(github)
