Python常用模块(time、numpy、pandas、matplotlib)之简单使用
一、time模块
- 常用的一种获取当前时间以及格式化模块,模块名称:time
导入方式:import time
1. 时间元祖属性
2. 常用方法
3. 使用
3.1 导包
import time
3.2 显示时间戳
print(time.time()) # 显示时间戳,1937年1月1日0:0:0至今的描述

# time.localtime(timetamp) timetamp 时间戳,这个参数不填默认为当前的时间戳
3.3 显示时间元祖
print(time.localtime()) # 显示时间元祖
3.4 time.altzone 表示返回格林威治西部夏令时区的偏移秒数
print(time.altzone)
3.5 时间元祖转换为时间字符串
# time.strftime(fmt,tupletime)
# 时间的格式化fmt
# %Y 四位数的年 %y两位数的年
print(time.strftime('%Y',time.localtime()))
print(time.strftime('%y',time.localtime()))
# %m 月份  %d 日
# %H 24进制的小时   %I 12进制小时
# %M 分钟 %S 秒数
# %a 本地简化星期名称 %A 本地星期名称
print(time.strftime('%Y/%m/%d %H:%M:%S %A',time.localtime()))
3.6 时间字符串转换为时间元祖
# time,strptime(timestr,fmt)
print(time.strptime('2018-03-27 13:11:30','%Y-%m-%d %H:%M:%S'))
二、scipy模块
- Scipy库是基于Python生态的一款开源数值计算、科学与工程应用的开源软件,主要包括NumPy、Scipy、pandas、matplotlib等
官方文档:https://scipy.org/
三、numpy模块
1. 简介
NumPy:Numerical Python,即数值Python包,是Python进行科学计算的一个基础包,所以是一个掌握其他Scipy库中模块的基础模块,一定需要先掌握该包的主使用方式。
- 官网:http://www.numpy.org/
- 官方文档:https://docs.scipy.org/doc/numpy/user/index.html
主要包括:
- 一个具有矢量算术运算和复杂广播能力的快速且节省空间多维数组,称为 ndarray (N -dimensional array object)
- 用于对整组数据进行快速运算的标准数学函数:ufunc(universal function object) object)
- 实用的线性代数、傅里叶变换和随机数生成函数
- Numpy和稀疏矩阵的运算包Scipy配合使用更加方便、
导入方式:import numpy as np
2. 核心数据结构 : ndarray
- ndarray(N-dimensional array):N维数组
- 一种由相同类型的元素组成多维数组,元素数量是实现给定好的
- 元素的数据类型有dtype(data-type)对象来指定,每个ndarray只有一种dtype类型
- ndarray的大小固定,创建好数组后数组的大小是不会发生改变的
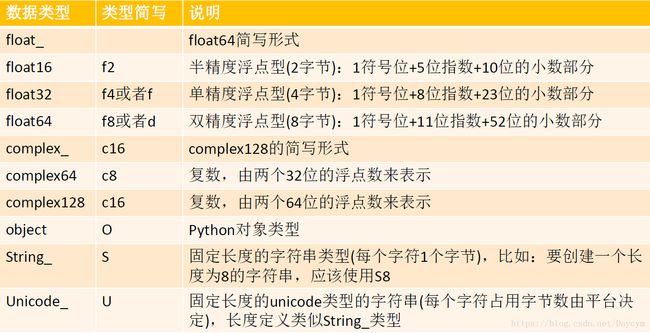
3. Numpy基本数据类型
4. 使用
4.1 约定导入方式
import numpy as np
4.2 建立Narry多维数组
arr=np.array(
    [
        [1,2,3,4],
        [2,3,4,5],
    ]
)
4.3 维度数量
arr.ndim
4.4 数组的形状,数组的每个维度的数据量
arr.shape
4.5 数组的数据类型
arr.dtype

np.array(
    [
        ['1','2','3','4']
    ]
)
4.6 数组中元素个数
arr.size
4.7 zeros函数 填充0
np.zeros(5) # 一维
np.zeros((3,2,2)) # 多维
np.zeros((2,1)) #第一个维度为2,第二个维度为1
4.8 ones函数 用1进行填充
np.ones((5,6)) # 默认数据类型是浮点数
np.ones((5,6),dtype=np.int) # 定义数据类型
4.9 empty函数 填充随机值
np.empty((2,4))
4.10 帮助文档
help(np.array)
4.11 ndarray创建方式
# 1. array函数
a =  np.array(
    [
        [89,95,83],
        [79,75,77],
        [74,51,88]
    ]
)
print(a)

# 2. arange
np.arange(2,20,3) # 从2到20,取不到20,步长为3

# 3. linspace函数 生成以等差数列
# 第一个值代表起始位置,第二个代表结束数,第三个生成元素的个数
np.linspace(2,20,3)
np.linspace(1,10,5,endpoint=False) # 相当于生成6个数,只显示前五个

# 4. logspace函数 生成一个等比数列
# 第一个值代表10的2次方,第二个数代表10的20次方,第三个数代表生成的元素的个数
np.logspace(2,20,6)
np.logspace(2,20,5,endpoint=False)

# 5. random函数 生成[0,1)随机数
np.random.random((2,3,4))
4.12 ndarray 属性
- 1) dtype:一个用于说明数组元素数据类型的对象
- 2) shape:一个数组的各维度大小的元祖,即数组的形状
- 3) size:元素总个数,即shape中各个数的相乘
- 4) ndim:一个数组的维度数量
arr=np.array(
    [
        [1,2,3,4],
        [2,3,4,5],
    ]
)
print("维度的数量",arr.ndim)
print("数组的形状",arr.shape)
print("数组的元素类型",arr.dtype)
print("数组的元素数量",arr.size)
4.13 改变array形状reshape函数
1.reshape函数不会改变原来的ndarray,但是得到的新的ndarray是原数组的视图
- 视图:多个变量使用(指向)一个内存地址(空间)
- arr2 = arr1.reshape((2,10))
- 副本:把原来的内容复制(拷贝)以一份新的数据,放到新的内存地址(空间)
即使修改了其中一个变量的元素值,并不会影响另外一个变量
2.对于ndarray的一些方法操作,首先要区分是否会改变原变量,以此来判断是视图还是副本
arr = np.arange(20)
arr.reshape((4,5))
arr2 = arr.reshape((2,-1))
arr2形状可变,元素总数不可变
arr3 = arr.copy() #拷贝,生成副本
4.14 Numpy算术运算
arr = np.arange(1,20,2)
arr + 2
arr ** 2
arr / 2
arr2 = np.arange(1,40,4)
arr + arr2
arr * arr2
arr / arr2
4.15 数组算术运算,必须保证两边的数组的形状一致
arr = np.random.random((2,3))
arr2 = np.random.random((3,2))

# arr + arr2 # 报错

arr2 + arr.reshape((3,2))
4.16 矩阵相乘必须满足第一个矩阵的列轴等于第二个矩阵的行轴值
new_arr1 = np.array(
    [
        [89,95,83],
        [79,75,77],
        [74,51,88]
    ]
)

new_arr2 = np.array(
    [
        [10,1],
        [6,10],
        [9,1]
    ]
)

new_arr1.dot(new_arr2)
4.17 切片(取元素,切片是一个视图)
arr3 = np.random.random((2,3,4))
arr3
arr3[0,1:]
arr3[0,[0,2]]
arr3[0,[0,2],1:3]
比如:
4.18 布尔型索引(筛选作用)
arr3>0.5
arr3[arr3>0.5]
4.19 花式索引
arr = np.arange(32).reshape((8,4))
arr
arr[[0,3,5]]
arr[[0,3,5],[0,3,2]] #前一个取出行,后一个按位取出对应的列

arr4 = np.array([
    'Tom','Day','Jack'
])
arr4[arr4=='Tom']=1
arr4

arr5 = np.arange(32).reshape((8,4))
arr5
np.ix_([0,3,5],[0,2,3])
arr5[np.ix_([0,3,5],[0,2,3])] #第一个表示取的行数,第二个表示取的列数
arr5[np.ix_([0,3,5],[0,2,1,3])] # ix_函数 生成一个索引器
4.20 数组转置与轴对换
arr7 = np.arange(32).reshape((8,4))
arr7
arr8 = arr7.T  # 数组转置   T属性为视图
arr8

arr7.transpose() # 数组轴对换
arr = np.random.random((3,4,5))
np.abs(arr)
np.sqrt(arr)
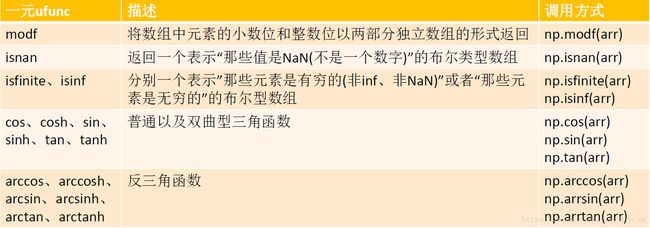
4.21 ndarray常用函数
一元函数
二元函数
# 1. abs
arr = np.random.random((3,4,5))
np.abs(arr)

# 2. sqrt
np.sqrt(arr)

# 3. power
arr = np.arange(10).reshape(2,-1)
arr1 = np.arange(10).reshape(2,-1)
np.power(arr,arr1) # 按位做power x的y次方

# 4. isnan
arr2 = np.empty((2,3,3))
arr2[1][1] = 'nan'
arr2
np.isnan(arr2)

# 5. add
arr3 = ([
    [1,2,3],
    [2,3,4],
    [3,4,5]
])
arr4 = ([
    [1,2,3],
    [2,3,4],
    [3,4,5]
])
np.add(arr3,arr4)
4.22 ndarray聚合函数
- 聚合函数是对一组值(eg一个数组)进行操作,返回一个单一值作为结果的函数。
- 当然聚合函数也可以指定对某个具体的轴进行数据聚合操作;
- 常用的聚合操作有:平均值、最大值、最小值、方差等
arr = np.array([[1,2,3,4],[7,8,9,10]])
print(arr)
print("min=",arr.min())
print("max=",arr.max())
print("mean=",arr.mean())
print("max=",arr.max(axis=0)) # 对同列的元素进行聚合
print("max=",arr.max(axis=1)) # 对同行的元素进行聚合
4.23 三元表达式where
满足True则显示第一个数组的对应位置的元素,否则显示第二个数组的对应位置的元素
xarr = np.array([1.1,2.2,3.3,4.4])
yarr = np.array([1.2,2.3,3.4,4.5])
bool_arr = np.array([True,False,False,True])
zip_arr = zip(xarr,yarr,bool_arr) # 数组合并
result = ['%.2f' %x if bl else '%.2f' %y for x,y,bl in zip_arr]result

np.where(bool_arr,xarr,yarr)
4.24 np.unique求数组非重复值
arr = np.array(['中国','美国','英国','美国','英国','中国'])
arr
# Python2不能直接输出,直接输出会乱码可用for循环打印
arr1 = np.unique(arr) # 取出唯一值
arr1
4.25 存取文本文件
#  1.读取文本数据
arr4 = np.loadtxt('1.txt',delimiter=',')
arr4
from io import StringIO
c = StringIO(u'0 1\n2 3')
c
np.loadtxt(c)
arr5 = np.genfromtxt('1.txt',delimiter=',') # 类似与loadtxt
arr5

# 2.数据写入文本文件
np.savetxt('arr.txt',arr5,delimiter=',')
np.savetxt('arr.txt',arr5,delimiter=',',fmt='%d')
arr3 = np.random.random((2,3,4)) # 如果是二维以上的数组,需要转换成二维的才能进行存储
np.savetxt('arr1.txt',arr3.reshape((4,6)),delimiter=',')
四、pandas模块
1. 简介
- pandas是一种Python数据分析的利器,是一个开源的数据分析包,最初是应用于金融数据分析工具而开发出来的,因此pandas为时间序列分析提供了很好的支持。 pandas是PyData项目的一部分。
引入约定
- from pandas import Series,DataFrame
- import pandas as pd
pandas中主要有两种数据结构,分别是:Series和DataFrame
- Series:一种类似于一维数组的对象,是由一组数据(各种NumPy数据类型)以及一组与之相关的数据标签 (即索引)组成。仅由一组数据也可产生简单的Series对象。注意:Series中的索引值是可以重复。
- DataFrame:一个表格型的数据结构,包含有一组有序的列,每列可以是不同的值类型 (数值、字符串、布尔型等),DataFrame即有行索引也有列索引,可以被看做是由Series组成的字典。
2. 使用
2.1 引入方式
import numpy as np # 用于配合使用

import pandas as pd
from pandas import DataFrame,Series # 数据框、一维数组
2.1 Series 一维数组创建
arr = np.arange(5) # 建立一个数组
series = Series(arr)
series

series.index  # 查看索引列
series.values # 查看数据列
series.dtype  # 查看数据类型
2.2 数据index绑定
series1 = Series([70,89,67],index=['张三','李四','王五'])
series1
series1.values  # 查看数据列
series1.index
2.3 通过字典的方式创建Series
a_dict = {'1':80,'2':90,'3':89}
series2 = Series(a_dict)
series2
series2.index
2.4 Series应用NumPy数组运算
b_dict = {'语文':80,'数学':90,'英语':89}
series3 = Series(b_dict)
series3[series3>89]
series3 / 10
2.5 Series缺失值
c_dict = {'语文':80,'数学':90,'英语':89}
series4 = Series(c_dict)
new_index = ['语文','数学','英语','地理','政治']
series4 = Series(series4,index=new_index)
series4
2.6 Series缺失值检测
pd.isnull(series4) # 为空的元素返回True

pd.notnull(series4) # 不为空的元素返回True

series4[pd.isnull(series4)] # 过滤出缺失值的项
2.7 Series自动对齐
num1 = Series([1,2,3,4,5],index=['a','b','c','d','e'])
num2 = Series([1,2,3,4,5],index=['c','a','e','b','d'])
total = num1 * num2
num1
num2
total
2.8 通过索引从Series中取值
num3 = Series([1,2,3,4,5],index=['a','b','c','d','e'])
num3
num3['a']
num3['b':'d'] # 边界,包含头尾
num3['c':]
num3[:'d'] = [2,3,4,5]
2.9 通过二维数组创建DataFrame
df1 = DataFrame([['Tom','Marry','John'],[76,78,80]])
df1
df2 = DataFrame([['Tom',76],['Marry',80],['John',90]])
df2
2.10 定义行索引和列索引
arr = np.array([['Tom',76],['Marry',80],['John',90]])
df3 = DataFrame(arr,columns=['name','score'])
df3
df4 = DataFrame(arr,index=['1','2','3'],columns=['name','score'])
df4
2.11 通过字典的方式创建DataFrame
data = {'name':['Tom','Jack','Dany'],
       'age':[23,24,22],
       'sal':[3000,5000,2800]}
df = DataFrame(data)
df
df.index
df.columns
df.values
df5 = DataFrame(data,index=['1','2','3'])
df5
2.12 通过索引从DataFrame中取值
data1 = {'name':['Tom','Jack','Dany'],
       'age':[23,24,22],
       'sal':[3000,5000,2800]}
df6 = DataFrame(data1)
df6
df6['age']

df6.loc[0]
2.13 通过传递值进行位置选择(选择的是行)
df6.iloc[0]
2.14 通过数值进行切片
df6.iloc[1:3] # 切片 行
df6.iloc[:,1:3] # 切片 列
df6.iloc[1:3,1:2] # 切片 行和列
df6.iloc[[1,2],[1,2]] # 1,2行,1,2列
df6['age'][0]  # 取出age列,第0行数据,从列开始取值
df6[1:]  # 如果使用切片,那么从行开始取值
2.15 获取指定位置的值
df6.iloc[2,2]

df6.iat[2,2]
2.16 布尔索引
# 1. 使用一个单独列的值来获取值
df6[df6.age > 23]

# 2. 整体过滤
df7 = DataFrame([[1,2,3,4,5,4,3,5],[2,3,4,2,3,6,7,4]])
df7
df7[df7 > 4] # 把所有不满足条件的全部置空(NaN)

# 3. isin() 过滤数据
df8 = df7.copy()
df8
df8[df8[1].isin(['3'])] # 检索1列中的数据,将满足3数据的行返回出来
2.17 数据文件读取
data1.csv
# 读取csv文件
df = pd.read_csv('data1.csv')
df
data2.txt
# 读取文本数据
# 指定属性分隔符为":",不读取头部数据
df = pd.read_csv("data2.txt", sep=':',header=None)
df
2.18 去除包含缺失值的行
s4 = DataFrame(np.array([
    [2,3,4,6,np.nan],
    [2,np.nan,3,4,6],
    [2,3,4,6,5]
]))
s4
s4.dropna(how = 'any')
2.19 对缺失值的替换
s5 = DataFrame(np.array([
    [2,3,4,6,np.nan],
    [2,np.nan,3,4,6],
    [2,3,4,6,5]
]))
s5
s5.fillna(value = 0)
2.20 对数据进行布尔填充,空值的判断
s6 = DataFrame(np.array([
    [2,3,4,6,np.nan],
    [2,np.nan,3,4,6],
    [2,3,4,6,5]
]))
pd.isnull(s6)
2.21 数据描述性统计
s6 = DataFrame(np.array([
    [2,3,4,6,np.nan],
    [2,np.nan,3,4,6],
    [2,3,4,6,5]
]))
s6.mean()
s6.describe()
s6.mean(1) # 对固定的轴进行统计操作
2.22 apply()对数据应用函数
s4 = DataFrame(np.array([
    [2,3,4,6,np.nan],
    [2,np.nan,3,4,6],
    [2,3,4,6,5]
]))
s4.apply(np.cumsum) # apply()对数据应用函数  应用累积和函数
s4.apply(lambda x:x.max()-x.min()) # 应用最大值-最小值
2.21 常见的数学统计方法
2.22 相关系数与协方差
- 相关系数(Correlation coefficient):反映两个样本/样本之间的相互关系以及之间的相关程度。在COV的基础上进行了无量纲化操作,也就是进行了标准化操作。
- 协方差(Covariance, COV):反映两个样本/变量之间的相互关系以
及之间的相关程度。
2.23 数据元素频率统计
n1 = np.random.randint(0,10,size=100)
n1
s1 = pd.Series(n1)
s1.value_counts() # 数据元素频率统计
五、matplotlib模块
1. 简介
- Python最常用的绘图库,提供了一整套十分适合交互式命令API ,比较方便的就可以将其嵌入到GUI应用程序中。
- 官网:http://matplotlib.org/
学习方式:
http://matplotlib.org/examples/index.html
http://matplotlib.org/gallery.html
2. Figure和Subplot
- Figure:面板(图),matplotlib中的所有图像都是位于figure对象中,一个图像只能有一个figure对象
- Subplot:子图,figure对象下创建一个或多个subplot对象(即axes)用于绘制图像
3. 约定命名
import matplotlib.pyplot as plt
4. 使用
4.1 画cos和sin图
import matplotlib.pyplot as plt
import numpy as np
X = np.linspace(-np.pi,np.pi,256,endpoint=True)
C = np.cos(X)
S = np.sin(X)
plt.plot(X,C)
plt.plot(X,S)
plt.show()
4.2 修改版
%matplotlib inline

# 创建一个8*6点(point)的图,并设置分别率为80
plt.figure(figsize=(8,6),dpi=80)

# 创建一个新的1*1的子图,接下来绘制在这个区域里
plt.subplot(1,1,1) # 1*1的子图绘制在第一块里
# 绘制余弦曲线,使用蓝色的、连续的、宽度为1(像素)的线条
plt.plot(X,C,color='blue',linewidth=1.0,linestyle='-.')
# 保存为图片
plt.savefig('1.png',dpi = 72)
# 设置横轴的上下限
plt.xlim(-2.0,2.0)
plt.plot(X,C,color='blue',linewidth=1.0,linestyle='-.')
# 显示图表
plt.show()
# 设置横轴记号
plt.xticks(np.linspace(-1,1,3,endpoint=True))
plt.plot(X,C,color='blue',linewidth=1.0,linestyle='-.')
plt.show()
# 移动脊柱
ax = plt.gca()
# 去除右边和上边的边框
ax.spines['right'].set_color('None')
ax.spines['top'].set_color('None')
# 绘制余弦曲线,使用蓝色的、连续的、宽度为1(像素)的线条
plt.plot(X,C,color='blue',linewidth=1.0,linestyle='-.')
plt.show()
# 解决中文输出问题
def show_word():
    from pylab import mpl
    mpl.rcParams['font.sans-serif']='FangSong' # 指定默认字体
    mpl.rcParams['axes.unicode_minus']=False
show_word()
4.3 详细版
# 解决中文输出问题
def show_word():
    from pylab import mpl
    mpl.rcParams['font.sans-serif']='FangSong' # 指定默认字体
    mpl.rcParams['axes.unicode_minus']=False
show_word()

# 移动脊柱
ax = plt.gca()
# 去除右边和上边的边框
ax.spines['right'].set_color('None')
ax.spines['top'].set_color('None')
# 设置x轴的位置
ax.xaxis.set_ticks_position('bottom')        # 设置坐标轴绑定的边框
ax.spines['bottom'].set_position(('data',0)) # 重新定义中心点
ax.yaxis.set_ticks_position('left')
ax.spines['left'].set_position(('data',0))
# 设置x轴名,如果是中文,会无法显示
ax.set_xticklabels(['中','b','c','中文','-e','f','g','h','i'])
# 绘制余弦曲线,使用蓝色的、连续的、宽度为1(像素)的线条
plt.plot(X,C,color='blue',linewidth=1.0,linestyle='-.',label='cos')
# label 设定线段的描述
plt.plot(X,S,color='green',linewidth=1.0,linestyle='-',label='sin')
# 在图表中显示线段的描述
plt.legend(loc='upper left')
# 给特殊点做注释
t = 2*np.pi/3  # 定义120度
# 设定cos描述
# 设定一个从(t,0)到(t,np.con(t))的一个线段
plt.plot([t,t],[0,np.cos(t)],color='blue',linewidth=2.0,linestyle='-.')
# 设定描述文本
# 第一个参数描述显示文本
# xy这个参数,传入显示文本的坐标
# xycoords 显示数据的模式
plt.annotate(r'$\cos(\frac{2\pi}{3})=-\frac{1}{2}$',xy=(t,np.cos(t)),
             xycoords='data',xytext=(2,-0.5),textcoords='offset points',
             fontsize=16)

# 设定sin描述
# 设定一个从(t,0)到(t,np.con(t))的一个线段
plt.plot([t,t],[0,np.sin(t)],color='green',linewidth=2.0,linestyle='-')
# 设定描述文本
# 第一个参数描述显示文本
# xy这个参数,传入显示文本的坐标
# xycoords 显示数据的模式
plt.annotate(r'$\sin(\frac{2\pi}{3})=\frac{\sqrt{3}}{2}$',xy=(t,np.sin(t)),
             xycoords='data',xytext=(2,-0.5),textcoords='offset points',
             fontsize=16)
plt.show()
4.4 样式
import matplotlib.pyplot as plt
import numpy as np
%matplotlib inline
# 上一行必不可少,在notebook中画图

x = np.linspace(0,10,20)
y = np.sin(x)

plt.plot(x,y)
plt.plot(x,np.cos(x))
plt.plot(x,y,'--')
fig = plt.figure()
plt.plot(x,y,'--')
# 保存图
fig.savefig('./data.png')

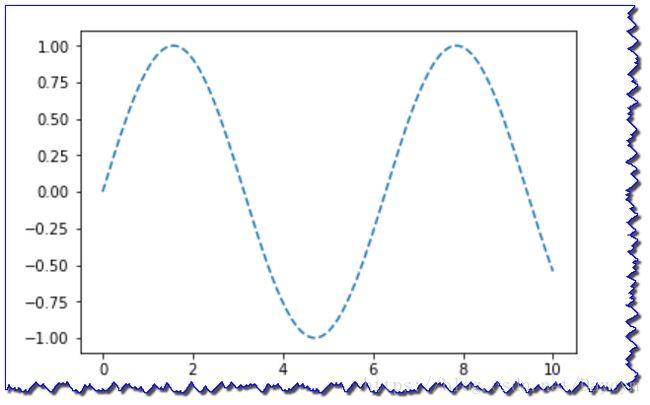
# 虚线样式
plt.subplot(2,1,1)
plt.plot(x,np.sin(x),'--')
# 实线样式
plt.subplot(2,1,2)
plt.plot(x,np.cos(x))
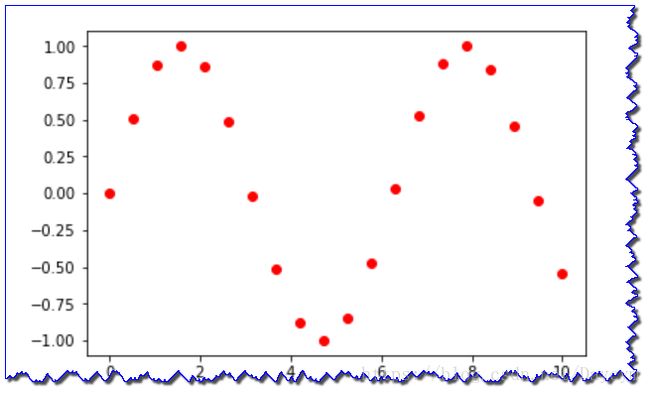
# 点状样式
x = np.linspace(0,10,20)
plt.plot(x,np.sin(x),'o',color='red')
# 加label
x = np.linspace(0,10,100)
y = np.sin(x)

plt.plot(x,y,label='sin(x)')
plt.plot(x,np.cos(x),'o',label='cos(x)')
# legend控制label的显示位置
plt.legend(loc = 1)
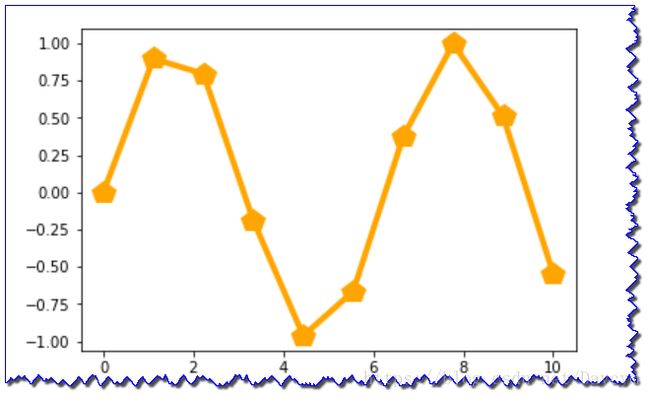
x = np.linspace(0,10,10)
y = np.sin(x)
plt.plot(x,y,'-p',color='orange',markersize=16,linewidth=4)
# xlim ylim限定范围
x = np.linspace(0,10,10)
y = np.sin(x)
plt.plot(x,y,'-p',color='orange',markersize=16,linewidth=4)
plt.ylim(-0.5,0.8)
plt.xlim(2,8)
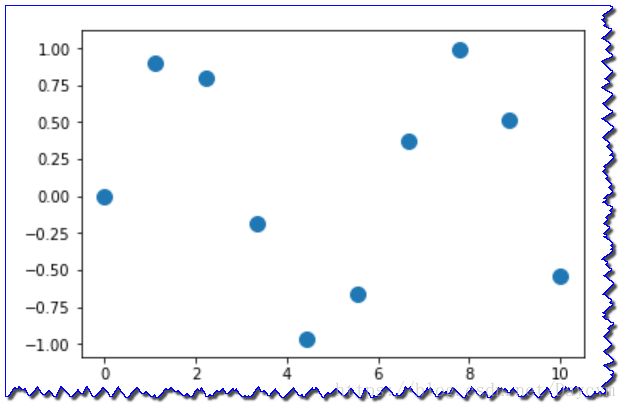
# 散点图
plt.scatter(x,y,s=100)
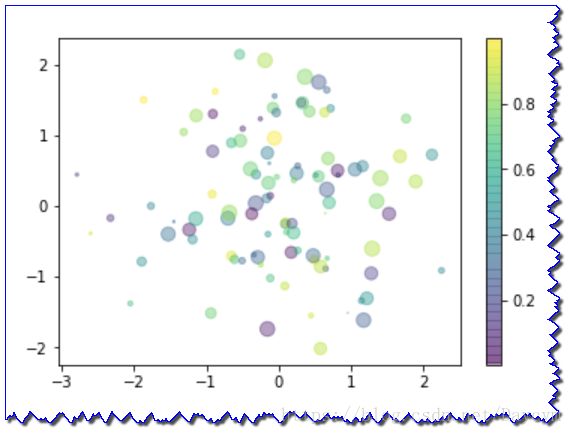
x = np.random.randn(100)
y = np.random.randn(100)
colors = np.random.rand(100)
sizes = 100 * np.random.rand(100)
plt.scatter(x,y,c=colors,s=sizes,alpha=0.4)
plt.colorbar()
4.5 线性图
df = pd.DataFrame(np.random.rand(100,4).cumsum(0),columns=['A','B','C','D'])
df.plot()
df.A.plot()
4.6 柱状图
df = pd.DataFrame(np.random.randint(10,50,(3,4)),columns=['A','B','C','D'], index=['one','two','three'])
df.plot.bar()
df.A.plot.bar()
# 等价于上面的绘制
df.plot(kind='bar')
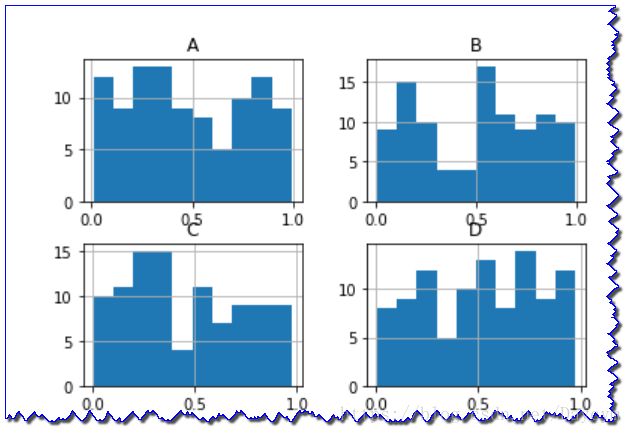
4.7 直方图
df = pd.DataFrame(np.random.rand(100,4),columns=['A','B','C','D'])
df.hist()
4.8 密度图
df.plot.kde()


