python可视化之散点图的绘制
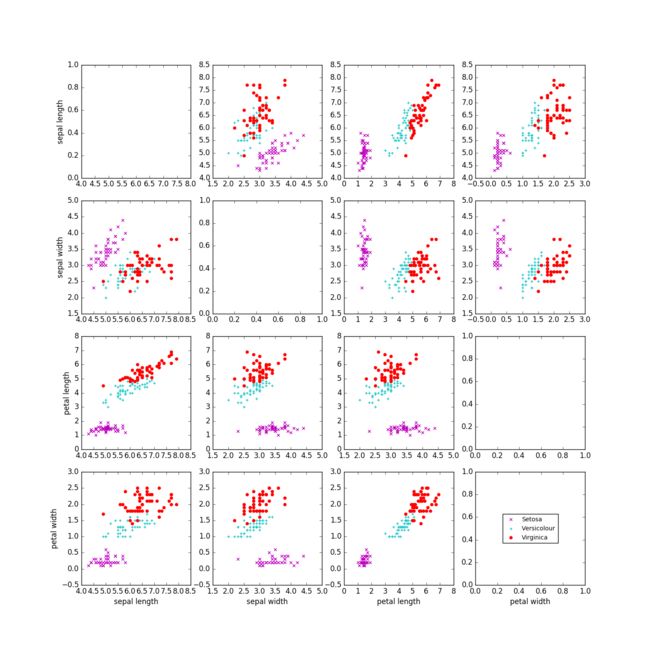
我们仍然以Iris数据集为例进行散点图的绘制,为了对不同的cell进行区分,我们需要使用plt.sca(cell)指明cell所在的位置。此外,如果使每个cell的横纵坐标的比例尺相等,可以在plt.subplots中添加额外的参数 sharex=True, sharey=True,在本例中不同的属性具有不同的scale,所以我们不需要设置相同的比例尺。实现的方法如下,欢迎各位指教。
#divide the data set to blocks
data_s0 = [x.split(',')[0] for x in content[0:50]]      #sepal length of setosa
#remove the none data
while '' in data_s0:
    data_s0.remove('')
#plot 16 subplots
fig, axes2d = plt.subplots(nrows=4, ncols=4,
                           figsize=(15,15))
for i, row in enumerate(axes2d):
    for j, cell in enumerate(row):
        if i==0 and j==0:
            plt.sca(cell)
            cell.set_ylabel("sepal length")
            plt.xlim(4,8)
            cell.set_xbound(lower=4.0, upper=8.0)
        if i==0 and j==1:
            plt.sca(cell)
            l1=plt.scatter(data_s1, data_s0, marker = 'x', color = 'm')
            l2=plt.scatter(data_ve1, data_ve0, marker = '+', color = 'c')
            l3=plt.scatter(data_vi1, data_vi0, marker = 'o', color = 'r')

        elif i==0 and j==2:
            plt.sca(cell)
            l1=plt.scatter(data_s2, data_s0, marker = 'x', color = 'm')
            l2=plt.scatter(data_ve2, data_ve0, marker = '+', color = 'c')
            l3=plt.scatter(data_vi2, data_vi0, marker = 'o', color = 'r')

            cell.set_autoscaley_on(False)
        elif i==0 and j==3:
            plt.sca(cell)
            l1=plt.scatter(data_s3, data_s0, marker = 'x', color = 'm')
            l2=plt.scatter(data_ve3, data_ve0, marker = '+', color = 'c')
            l3=plt.scatter(data_vi3, data_vi0, marker = 'o', color = 'r')

        elif i==1 and j==0:
            plt.sca(cell)
            cell.set_ylabel("sepal width")
            l1=plt.scatter(data_s0, data_s1, marker = 'x', color = 'm')
            l2=plt.scatter(data_ve0, data_ve1, marker = '+', color = 'c')
            l3=plt.scatter(data_vi0, data_vi1, marker = 'o', color = 'r')

        elif i==1 and j==1:
            plt.sca(cell)

        elif i==1 and j==2:
            plt.sca(cell)
            l1=plt.scatter(data_s2, data_s1, marker = 'x', color = 'm' )
            l2=plt.scatter(data_ve2, data_ve1, marker = '+', color = 'c')
            l3=plt.scatter(data_vi2, data_vi1, marker = 'o', color = 'r')

        elif i==1 and j==3:
            plt.sca(cell)
            l1=plt.scatter(data_s3, data_s1, marker = 'x', color = 'm')
            l2=plt.scatter(data_ve3, data_ve1, marker = '+', color = 'c')
            l3=plt.scatter(data_vi3, data_vi1, marker = 'o', color = 'r')

        elif i==2 and j==0:
            plt.sca(cell)
            cell.set_ylabel("petal length")
            l1=plt.scatter(data_s0, data_s2, marker = 'x', color = 'm')
            l2=plt.scatter(data_ve0, data_ve2, marker = '+', color = 'c')
            l3=plt.scatter(data_vi0, data_vi2, marker = 'o', color = 'r')

        elif i==2 and j==1:
            plt.sca(cell)

            l1=plt.scatter(data_s1, data_s2, marker = 'x', color = 'm')
            l2=plt.scatter(data_ve1, data_ve2, marker = '+', color = 'c')
            l3=plt.scatter(data_vi1, data_vi2, marker = 'o', color = 'r')

        elif i==2 and j==2:
            plt.sca(cell)

        elif i==2 and j==3:
            plt.sca(cell)
            l1=plt.scatter(data_s3, data_s2, marker = 'x', color = 'm')
            l2=plt.scatter(data_ve3, data_ve2, marker = '+', color = 'c')
            l3=plt.scatter(data_vi3, data_vi2, marker = 'o', color = 'r')

        elif i==3 and j==0:
            plt.sca(cell)
            cell.set_ylabel("petal width")
            cell.set_xlabel("sepal length")
            l1=plt.scatter(data_s0, data_s3, marker = 'x', color = 'm')
            l2=plt.scatter(data_ve0, data_ve3, marker = '+', color = 'c')
            l3=plt.scatter(data_vi0, data_vi3, marker = 'o', color = 'r')

        elif i==3 and j==1:
            plt.sca(cell)
            cell.set_xlabel("sepal width")
            l1=plt.scatter(data_s1, data_s3, marker = 'x', color = 'm' )
            l2=plt.scatter(data_ve1, data_ve3, marker = '+', color = 'c')
            l3=plt.scatter(data_vi1, data_vi3, marker = 'o', color = 'r')

        elif i==3 and j==2:
            plt.sca(cell)
            cell.set_xlabel("petal length")
            l1=plt.scatter(data_s2, data_s3, marker = 'x', color = 'm')
            l2=plt.scatter(data_ve2, data_ve3, marker = '+', color = 'c')
            l3=plt.scatter(data_vi2, data_vi3, marker = 'o', color = 'r')

        elif i==3 and j==3:
            plt.sca(cell)
            cell.set_xlabel("petal width")

        else:
            pass

plt.legend((l1, l2, l3),
           ('Setosa', 'Versicolour', 'Virginica'),
           scatterpoints=1,
           loc='center',
           ncol=1,
           fontsize=10)
#save the image
fig.savefig("../image/matrix_of_scatte_ plots_for_the_Iris_data_set.png")
#show the image
plt.show()
效果图如下: