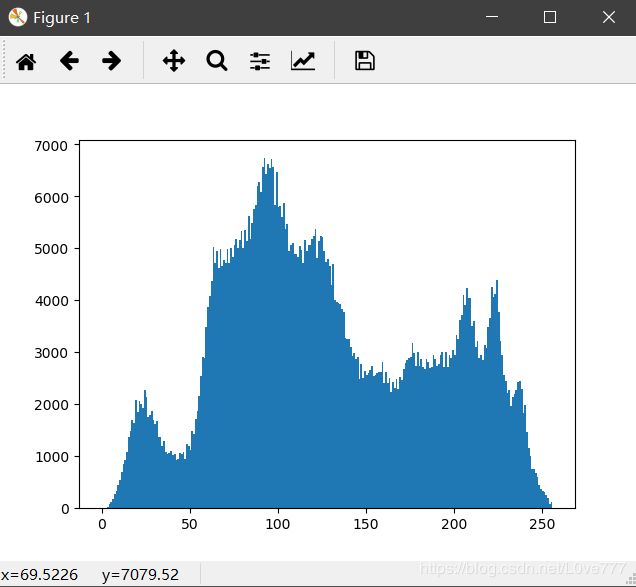
matplotlib生成单通道histtogram
def plot_demo(image):
    plt.hist(image.ravel(), 256, [0, 256])  # numpy的ravel函数功能是将多维数组降为一维数组
    plt.show("histogram")

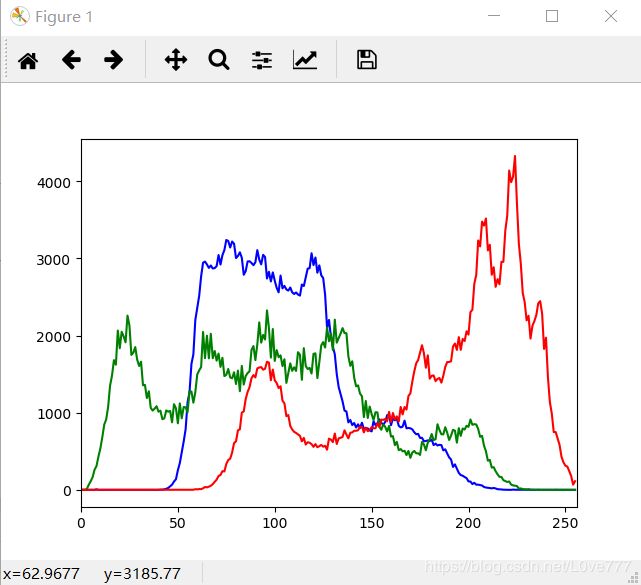
calcHist生成三通道histtogram
def image_hist_demo(image):
    """彩色图像直方图"""
    color = ('blue', 'green', 'red')
    for i, Color in enumerate(color):
        hist = cv.calcHist([image], [i], None, [256], [0.0, 256.0])
        """
        cv.calcHist(images, channels, mask, histSize, ranges[, hist[, accumulate]])
        images:它是uint8类型或float32的源图像。它应该用方括号括起来,也就是”[img]”。
        channels:它也用方括号括起来。它是我们计算直方图的信道的索引。例如,如果输入是灰度图像,它的值是0。对于颜色图像,您可以通过0、1或2来分别计算蓝色、绿色或红色通道的直方图。
        mask:遮罩图。为了找到完整图像的直方图,它被指定为“None”。但如果你想找到图像的特定区域的直方图,你必须为它创建一个遮罩图,并将其作为遮罩。
        histSize:这代表了我们的BINS数。需要用方括号来表示。表示多少个直柱。
        ranges:强度值范围,通常是 [ 0,256 ]
        """
        plt.plot(hist, color=Color)
        plt.xlim([0, 256])
    plt.show()

全局直方图均匀化
def hist_equal_demo(image):
    """
    全局直方图均衡化:
    增强图片对比度
    """
    gray = cv.cvtColor(image, cv.COLOR_BGR2GRAY)  # 转化成灰度图
    cv.imshow("gray", gray)
    dst = cv.equalizeHist(gray)
    cv.imshow("equal Hist", dst)
自适应直方图均匀化
def clahe_demo(image):
    """
    自适应直方图均衡化:
    增加图片对比度
    """
    gray = cv.cvtColor(image, cv.COLOR_BGR2GRAY)
    cv.imshow("gray", gray)
    clahe = cv.createCLAHE(clipLimit=3.0, tileGridSize=(8, 8))
    """
    clipLimit:表示对比度的大小
    tileGridSize:表示每次处理块的大小
    """
    dst = clahe.apply(gray)
    cv.imshow("clahe Hist", dst)
直方图比较
def create_rgb_hist(image):
    """生成rgb直方图"""
    h, w, c = image.shape
    rgb_hist = np.zeros([16*16*16, 1], np.float32)  # 空白直方图
    bin_size = 256/16
    for row in range(h):
        for col in range(w):
            b = image[row, col, 0]
            g = image[row, col, 1]
            r = image[row, col, 2]
            index = np.int(b/bin_size)*16*16 + np.int(g/bin_size)*16 + np.int(r/bin_size)
            rgb_hist[np.int(index), 0] = rgb_hist[np.int(index), 0] + 1
    return rgb_hist


def hist_compare(img1, img2):
    hist1 = create_rgb_hist(img1)
    hist2 = create_rgb_hist(img2)
    match1 = cv.compareHist(hist1, hist2, cv.HISTCMP_BHATTACHARYYA)  # 巴氏距离比较,距离越小越相似
    match2 = cv.compareHist(hist1, hist2, cv.HISTCMP_CORREL)  # 相关性比较,相关性越大越相似

    match3 = cv.compareHist(hist1, hist2, cv.HISTCMP_CHISQR)  # 卡方比较,越大越不相似
    print("巴氏距离:%s, 相关性:%s, 卡方:%s" % (match1, match2, match3))

代码
# -*- coding: utf-8 -*-
# By:iloveluoluo
# 2019.3.26
import cv2 as cv
import numpy as np
from matplotlib import pyplot as plt

# 图像直方图:histogram
# 直方图均衡化:OpenCV基于灰度图像
# 直方图比较


def plot_demo(image):
    plt.hist(image.ravel(), 256, [0, 256])  # numpy的ravel函数功能是将多维数组降为一维数组
    plt.show("histogram")


def image_hist_demo(image):
    """彩色图像直方图"""
    color = ('blue', 'green', 'red')
    for i, Color in enumerate(color):
        hist = cv.calcHist([image], [i], None, [256], [0.0, 256.0])
        """
        cv.calcHist(images, channels, mask, histSize, ranges[, hist[, accumulate]])
        images:它是uint8类型或float32的源图像。它应该用方括号括起来,也就是”[img]”。
        channels:它也用方括号括起来。它是我们计算直方图的信道的索引。例如,如果输入是灰度图像,它的值是0。对于颜色图像,您可以通过0、1或2来分别计算蓝色、绿色或红色通道的直方图。
        mask:遮罩图。为了找到完整图像的直方图,它被指定为“None”。但如果你想找到图像的特定区域的直方图,你必须为它创建一个遮罩图,并将其作为遮罩。
        histSize:这代表了我们的BINS数。需要用方括号来表示。表示多少个直柱。
        ranges:强度值范围,通常是 [ 0,256 ]
        """
        plt.plot(hist, color=Color)
        plt.xlim([0, 256])
    plt.show()


def hist_equal_demo(image):
    """
    全局直方图均衡化:
    增强图片对比度
    """
    gray = cv.cvtColor(image, cv.COLOR_BGR2GRAY)  # 转化成灰度图
    cv.imshow("gray", gray)
    dst = cv.equalizeHist(gray)
    cv.imshow("equal Hist", dst)


def clahe_demo(image):
    """
    自适应直方图均衡化:
    增加图片对比度
    """
    gray = cv.cvtColor(image, cv.COLOR_BGR2GRAY)
    cv.imshow("gray", gray)
    clahe = cv.createCLAHE(clipLimit=3.0, tileGridSize=(8, 8))
    """
    clipLimit:表示对比度的大小
    tileGridSize:表示每次处理块的大小
    """
    dst = clahe.apply(gray)
    cv.imshow("clahe Hist", dst)


def create_rgb_hist(image):
    """生成rgb直方图"""
    h, w, c = image.shape
    rgb_hist = np.zeros([16*16*16, 1], np.float32)  # 空白直方图
    bin_size = 256/16
    for row in range(h):
        for col in range(w):
            b = image[row, col, 0]
            g = image[row, col, 1]
            r = image[row, col, 2]
            index = np.int(b/bin_size)*16*16 + np.int(g/bin_size)*16 + np.int(r/bin_size)
            rgb_hist[np.int(index), 0] = rgb_hist[np.int(index), 0] + 1
    return rgb_hist


def hist_compare(img1, img2):
    hist1 = create_rgb_hist(img1)
    hist2 = create_rgb_hist(img2)
    match1 = cv.compareHist(hist1, hist2, cv.HISTCMP_BHATTACHARYYA)  # 巴氏距离比较,距离越小越相似
    match2 = cv.compareHist(hist1, hist2, cv.HISTCMP_CORREL)  # 相关性比较,相关性越大越相似

    match3 = cv.compareHist(hist1, hist2, cv.HISTCMP_CHISQR)  # 卡方比较,越大越不相似
    print("巴氏距离:%s, 相关性:%s, 卡方:%s" % (match1, match2, match3))


src1 = cv.imread('E:/MyFile/Picture/date/WindowsLogo.jpg')
src2 = cv.imread('E:/MyFile/Picture/date/LinuxLogo.jpg')
cv.imshow("src1 demo", src1)
cv.imshow("src2 demo", src2)

# plot_demo(src1)
# image_hist_demo(src1)
# clahe_demo(src1)
# hist_equal_demo(src1)
hist_compare(src1, src2)

cv.waitKey(0)
cv.destroyAllWindows()


