matplotlib.pyplot.plot()参数详解、线形图、条形图、散点图、饼状图、画布大小、位置、颜色、标题、图例、坐标轴刻度设置 实例详解
文章目录
- matplotlib.pyplot.plot()绘图文档
- 1. plot函数的一般的调用形式:
- 2. 参数fmt,以及一些常用参数举例
- 3.一些图形的绘制
- 1.线形图plt
- 2. 柱形图/条形图 plt.bar,plt.barh
- 3. 散点图plt.scatter
- 4. 饼图plt.pie
- 5. 画布设置
- 5.1 画布大小plt.figure、位置plt.subplot、网格设置grid
- 3.设置标题plt.title,坐标轴标签 plt.xlabel、plt.ylabel,颜色等
- 4. 设置图例 plt.legend()
matplotlib.pyplot.plot()绘图文档
在交互环境中查看英文帮助文档:
import matplotlib.pyplot as plt
help(plt.plot)
1. plot函数的一般的调用形式:
####单条线:
plot([x], y, [fmt], data=None, **kwargs)
####多条线一起画
plot([x], y, [fmt], [x2], y2, [fmt2], …, **kwargs)
2. 参数fmt,以及一些常用参数举例
可选参数[fmt] 是一个字符串来定义图的基本属性如:颜色(color),点型(marker),线型(linestyle),
具体形式 fmt = ‘[color][marker][line]’,如指定fmt为’bo-’ # 蓝色圆点实线
fmt接收的是每个属性的单个字母缩写,例如:plot(x, y, ‘bo-’) # 蓝色圆点实线
若属性用的是全名则不能用fmt参数来组合赋值,应该用关键字参数对单个属性赋值如:
plot(x,y2,color=‘green’, marker=‘o’, linestyle=‘dashed’, linewidth=1, markersize=6)
(1) 其中常见的颜色参数:colors
也可以对关键字参数color赋十六进制的RGB字符串如 color=’#900302’
=============    ===============================
character        color
=============    ===============================
``'b'``          blue 蓝
``'g'``          green 绿
``'r'``          red 红
``'c'``          cyan 蓝绿
``'m'``          magenta 洋红
``'y'``          yellow 黄
``'k'``          black 黑
``'w'``          white 白
(2) 点型参数Markers
用关键字参数对单个属性赋值,如:marker=’+'这个只有简写,英文描述不被识别
=============    ===============================
character        description
=============    ===============================
``'.'``          point marker 点标记
``','``          pixel marker 像素标记
``'o'``          circle marker 圆圈标记
``'v'``          triangle_down marker 下三角标记
``'^'``          triangle_up marker 上三角标记
``'<'``          triangle_left marker 左三角标记
``'>'``          triangle_right marker 右三角标记
``'1'``          tri_down marker
``'2'``          tri_up marker
``'3'``          tri_left marker
``'4'``          tri_right marker
``'s'``          square marker 方块标记
``'p'``          pentagon marker 五边形标记
``'*'``          star marker 星花*标记
``'h'``          hexagon1 marker 六边形标记
``'H'``          hexagon2 marker 六边形标记
``'+'``          plus marker 加好标记
``'x'``          x marker x标记
``'D'``          diamond marker 方菱形标记
``'d'``          thin_diamond marker 瘦菱形标记
``'|'``          vline marker 竖线标记
``'_'``          hline marker 下划线标记
(3) 线型参数Line Styles,
用关键字参数对单个属性赋值,如:linestyle=’-’
=============    ===============================
character        description
=============    ===============================
``'-'``          solid line style 实线
``'--'``         dashed line style 虚线
``'-.'``         dash-dot line style 点画线
``':'``          dotted line style 点线
=============    ===============================
3.一些图形的绘制
1.线形图plt
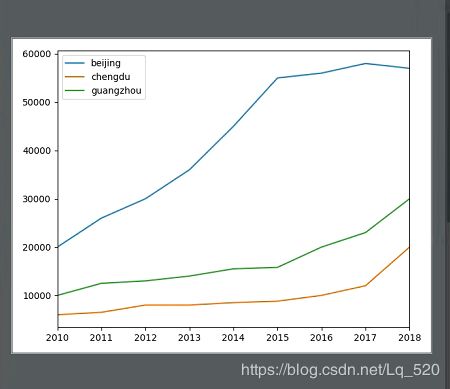
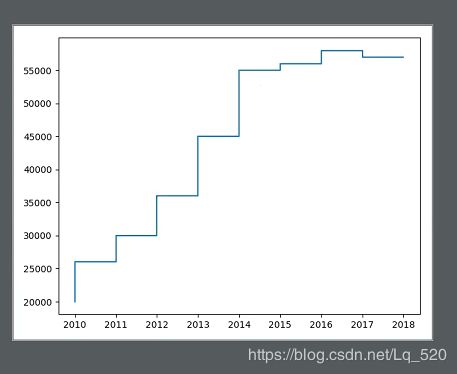
data1 = Series(data=[20000, 26000, 30000, 36000, 45000, 55000, 56000, 58000, 57000],
    index=[2010, 2011, 2012, 2013, 2014, 2015, 2016, 2017, 2018], name='beijing')
data2 = Series(data=[6000, 6500, 8000, 8000, 8500, 8800, 10000, 12000, 20000],
               index=[2010, 2011, 2012, 2013, 2014, 2015, 2016, 2017, 2018], name='chengdu')
data3 = Series(data=[10000, 12500, 13000, 14000, 15500, 15800, 20000, 23000, 30000],
               index=[2010, 2011, 2012, 2013, 2014, 2015, 2016, 2017, 2018], name='guangzhou')
price = DataFrame({
    'beijing': data1,
    'chengdu': data2,
    'guangzhou': data3
})
# DataFrame绘制线型图,每一列成为一条线,表示每一个特征的走势,有几个特征就绘制几条数据线
print(price)
price.plot()
plt.show()

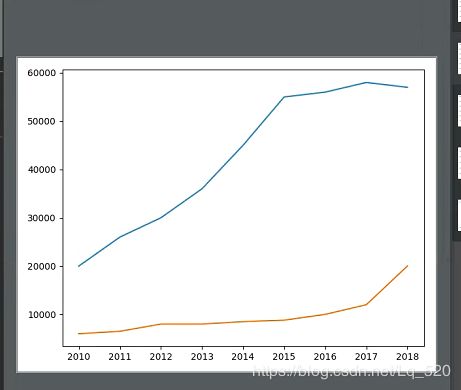
# 只含单一曲线的图
# •1、可以使用多个plot函数(推荐),在一个图中绘制多个曲线
# •2、也可以在一个plot函数中传入多对X,Y值,在一个图中绘制多个曲线
plt.plot(data1.index, data1.values)
plt.plot(data2.index, data2.values)
plt.show()
# 上下两个结果一致
plt.plot(data1.index, data1.values, data2.index, data2.values)
plt.show()
2. 柱形图/条形图 plt.bar,plt.barh
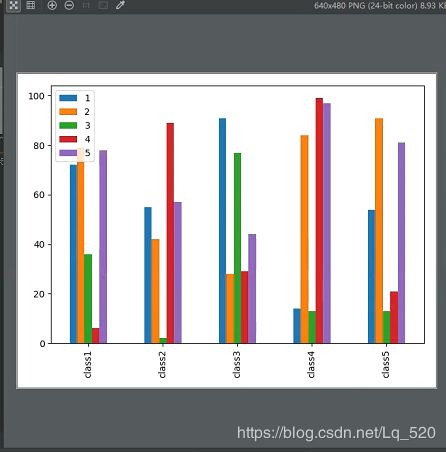
#series方式 # python_score = Series(data=np.random.randint(0, 100, size=5), index=['class1', 'class2', 'class3', 'class4', 'class5'],)
# dataFrame方式
python_score = pd.DataFrame(
     data=[np.random.randint(0, 100, size=5), np.random.randint(0, 100, size=5), np.random.randint(0, 100, size=5),
           np.random.randint(0, 100, size=5), np.random.randint(0, 100, size=5)],
     index=['class1', 'class2', 'class3', 'class4', 'class5'], columns=[1, 2, 3, 4, 5])
print(python_score)
python_score.plot(kind='bar')
plt.show()
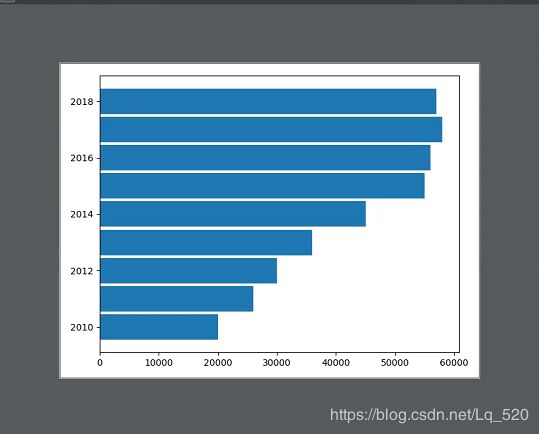
# 条形图
# 横向条形图
# x index
# height values
# width  条形宽度
# plt.bar(data1.index,data1.values,width=0.9)

# 纵向条形图
# y index
# data1.indewidth values
# height 条形宽度
plt.barh(data1.index, data1.values, height=0.9)
plt.show()
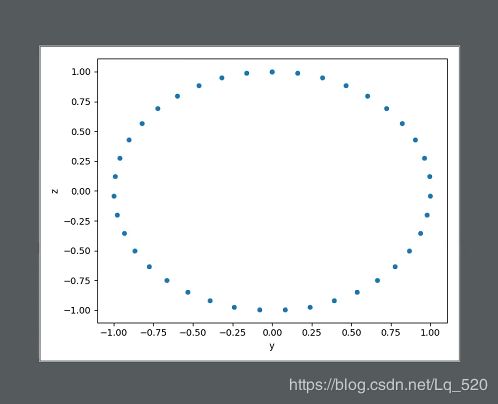
3. 散点图plt.scatter
x = np.linspace(0, 2 * np.pi, 40)
# 正弦
y = np.sin(x)
# 余弦
z = np.cos(x)

sin_func = DataFrame({
    'x': x,
    'y': y,
    'z': z
})
# x、y 表示映射在x\y轴的数据
sin_func.plot(kind='scatter', x='y', y='z')
plt.show()
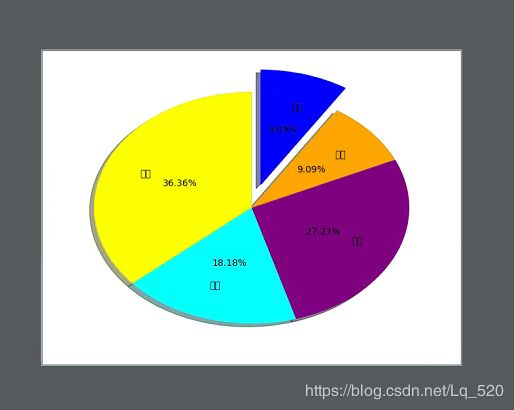
4. 饼图plt.pie
# 饼图的外观设置
# labels参数设置每一块的标签;
# labeldistance参数设置标签距离圆心的距离(比例值,只能设置一个浮点小数)
# autopct参数设置比例值的显示格式(%1.1f%%);
# pctdistance参数设置比例值文字距离圆心的距离
# explode参数设置每一块顶点距圆形的长度(比例值,列表);
# colors参数设置每一块的颜色(列表);
# shadow参数为布尔值,设置是否绘制阴影
# startangle参数设置饼图起始角度

data = [4, 2, 3, 1, 1]
values = plt.pie(data, labels=['小学', '初中', '高中', '大学', '现在'], labeldistance=0.7,
                 autopct='%.2f%%', pctdistance=0.5, explode=[0, 0, 0, 0, 0.2],
                 colors=['yellow', 'cyan', 'purple', 'orange', 'blue'], shadow=True,
                 startangle=90)
5. 画布设置
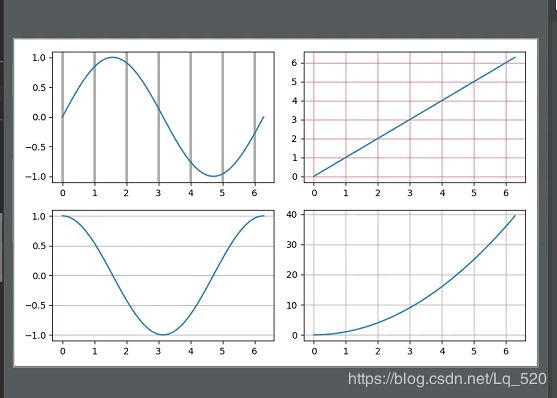
5.1 画布大小plt.figure、位置plt.subplot、网格设置grid
x = np.linspace(0, 2 * np.pi, 100)
# figure对象就是父画布对象,可以在figure方法里调整父画布大小
figure = plt.figure(figsize=(8, 5))

# 一个画布中可以存在多个子画布对象
# 下面演示如何设置子画布的位置
# subplot 1.切分的行数 2.切分的列数,3.按照前两者的切分方式字画布的放置位置(从1开始)
# subplot参数只是为了描述子画布位置的虚拟数据,并不是真的把父试图进行切割
# 如果两个子画布有重叠的区间,后绘制的画布会覆盖先绘制的
axes1 = plt.subplot(2, 2, 1)
axes1.plot(x, np.sin(x))
axes1.grid(axis='x', linewidth=3)

axes2 = plt.subplot(2, 2, 2)
axes2.plot(x, x)

# grid设置网格
# color html颜色都支持
# linewidth 整数
# alpha 0-1 浮点
# axis  x,y,both 开启网格线的方向设置
axes2.grid(color='red', alpha=0.5)

axes3 = plt.subplot(223)
axes3.plot(x, np.cos(x))
axes3.grid(axis='y')

axes4 = plt.subplot(224)
axes4.plot(x, x ** 2)
axes4.grid()
plt.show()
3.设置标题plt.title,坐标轴标签 plt.xlabel、plt.ylabel,颜色等
#使用plt设置 fontsize 标题大小,color 是颜色  ro
plt.plot(data1.index, data1.values)
plt.xlabel('years', fontsize=15, color='green')
plt.ylabel('price', fontsize=15, color='red', rotation=60)
plt.title('years-price',fontsize=20,color='orange',rotation=50)
plt.show()
 # 子画布时使用以下
axes = plt.subplot(122)
axes.plot(data1.index, data1.values)
axes.set_xlabel('years', fontsize=15, color='green')
axes.set_ylabel('price', fontsize=15, color='red', rotation=60)
axes.set_title('years-price',fontsize=20,color='orange')
plt.show()
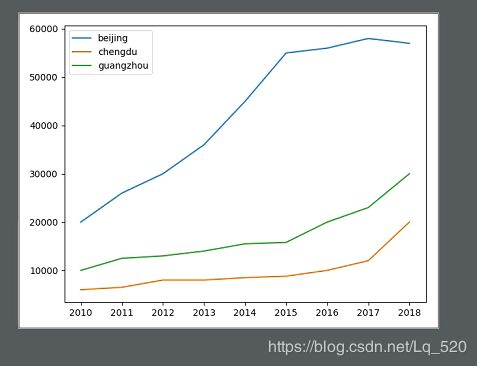
4. 设置图例 plt.legend()
分别设置每一条线的标签,然后再调用plt.legend来显示
plt.plot(data1.index,data1.values,label='beijing')
plt.plot(data2.index,data2.values,label=data2.name)
plt.plot(data3.index,data3.values,label=data3.name)
plt.legend()
plt.show()
5.线的外观设置
•linestyle(ls) 设置线的风格
•linewidth(lw) 设置线宽
•alpha 透明度
•color 颜色
•marker 点形
•markersize 点大小
•markeredagecolor 点的边界颜色
•markeredagewidth 点的边界宽度
•markerfacecolor 点的主体颜色
线的模式
linestyle 参数 ls
----.:\steps\dashes
plt.plot(data1.index,data1.values,ls='steps')
plt.show()
6.设置坐标轴刻度 plt.xticks
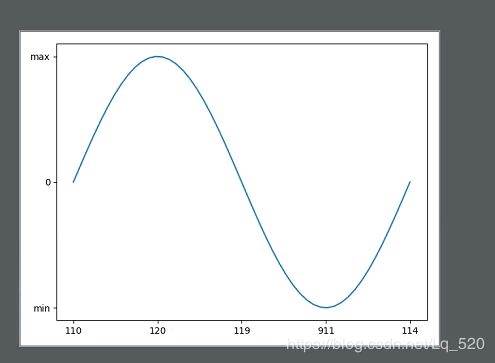
x = np.linspace(0, 2 * np.pi, 50)
y = np.sin(x)
plt.plot(x, y)
# 如果没有制定刻度标签,则以真实值作为刻度标签展示
# plt.xticks([0,np.pi/2,np.pi,3*np.pi/2,2*np.pi],[0,'Π/2','Π','3Π/2','2Π'])
plt.xticks([0, np.pi / 2, np.pi, 3 * np.pi / 2, 2 * np.pi], [110, 120, 119, 911, 114])
plt.yticks([-1, 0, 1], ['min', 0, 'max'])
plt.show()
