常用函数图像
1. ![]()
plotFun(x^2/2+y^2/2 ~ x & y, x.lim=range(-10,10),y.lim=range(-10,10),surface = TRUE)
等高线图:
plotFun(x^2/2+y^2/2 ~ x & y, x.lim=range(-10,10),y.lim=range(-10,10),ntps=1000)
除非显式指定参数 surface = TRUE, 否则默认就是等高线图, npts 默认值为 50, 调高这个值可使颜色填充更细腻.
虽然很粗糙,但如果不填充颜色, 生成的图片也是够难看的,如:
plotFun(x^2+y^2 ~ x & y, x.lim=range(-40,40),y.lim=range(-40,40),filled = FALSE)不标出等高线的值
plotFun(x^2+y^2 ~ x & y, x.lim=range(-40,40),y.lim=range(-40,40),nlevels = 20,labels = FALSE)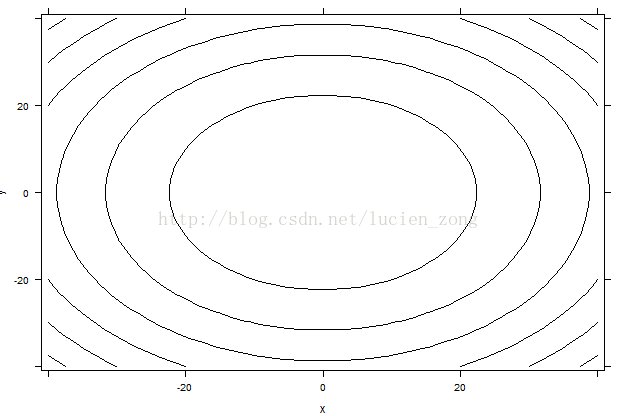
2. ![]()
plotFun(sin(2*pi*t/10)*exp(-.2*x) ~ t & x,t.lim=range(0,20),x.lim=range(0,10),surface = TRUE)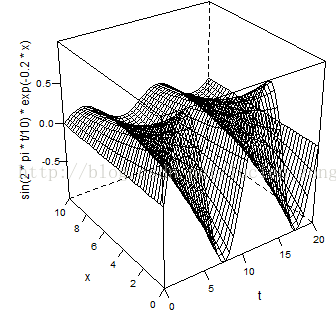
3. ![]()
plotFun(-x^2+y^2-10 ~ x & y, x.lim=range(-5,5),y.lim=range(-5,5),surface = TRUE)
4. ![]()
c = makeFun(1-x^2-y^2 ~ x & y)
#optimize(c,c(10,-10))
plotFun(c(x,y) ~ x  & y, x.lim=range(-5,5),y.lim=range(-5,5),surface = TRUE)