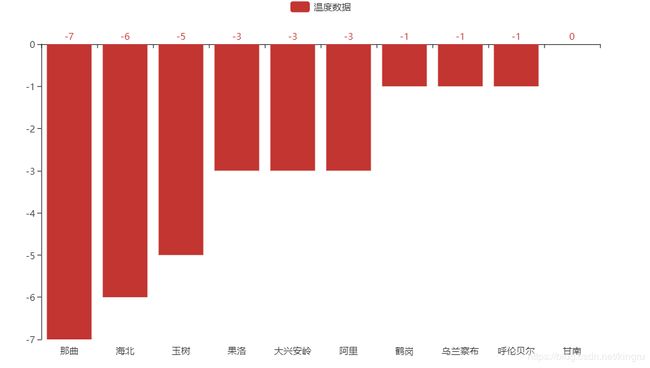
pyecharts中的Bar作柱状图(坐标系成功显示)数据未显示(我所出现问题的解决方法)
自学爬虫时遇到不少坑啊,第一次使用pyecharts
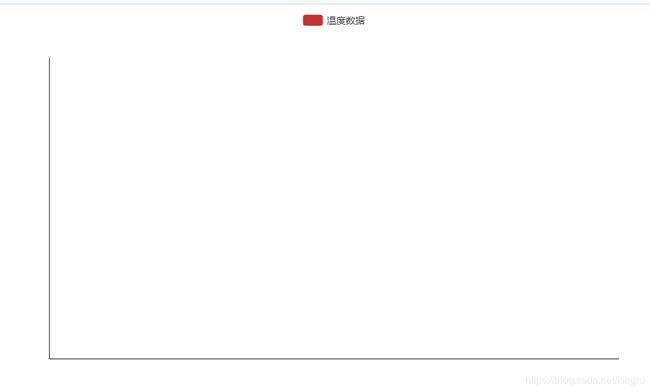
然后出现了这个状况
嗯?!怎么只显示了表?
首先我怀疑是数据包的问题然后根据大佬的方法
下载安装pyecharts
重新安装大量数据包,我安装的是最新版的pyecharts.可是依然未显示数据。。
首先要知道新版和旧版的使用区别:
pyecharts新旧的使用区别
搜索了许久也得到了许多方法,不过似乎都不是我显示的错误。以下是我的代码:
import requests
from bs4 import BeautifulSoup
from pyecharts.charts import Bar
data_s = []
def parse_url(url):
    headers = {'User-Agent': 'Mozilla/5.0 (Windows NT 10.0; Win64; x64) AppleWebKit/537.36 (KHTML, like'
                             ' Gecko) Chrome/70.0.3538.102 Safari/537.36 Edge/18.18362',
               'Referer': 'http://www.weather.com.cn/forecast/'}
    response = requests.get(url, headers=headers)
    text = response.content.decode('utf-8')
    soup = BeautifulSoup(text, 'html5lib')
    divs = soup.find('div', class_='conMidtab')
    tables = divs.find_all('table')
    for table in tables:
        trs = table.find_all('tr')[2:]
        for index, tr in enumerate(trs):
            tds = tr.find_all('td')
            city_td = tds[0]
            if index == 0:
                city_td = tds[1]
            city = list(city_td.stripped_strings)[0]
            temp_td = tds[-2]
            temp = list(temp_td.stripped_strings)[0]
            # print({"city": city, "temp": temp})
            data_s.append({"city": city, "temp": int(temp)})
def main():
    urls = {
        'http://www.weather.com.cn/textFC/hb.shtml',
        'http://www.weather.com.cn/textFC/db.shtml',
        'http://www.weather.com.cn/textFC/hd.shtml',
        'http://www.weather.com.cn/textFC/hz.shtml',
        'http://www.weather.com.cn/textFC/hn.shtml',
        'http://www.weather.com.cn/textFC/xb.shtml',
        'http://www.weather.com.cn/textFC/xn.shtml',
        'http://www.weather.com.cn/textFC/gat.shtml',
    }
    for url in urls:
        parse_url(url)
    data_s.sort(key=lambda data: data['temp'])
    data = data_s[0:10]
    cities = map(lambda x: x['city'], data)
    temps = map(lambda x: x['temp'], data)
    chart = Bar()
    chart.add_yaxis('温度数据', temps)
    chart.add_xaxis(cities)
    chart.render()
if __name__ == '__main__':
    main()
输出此处时
cities = map(lambda x: x['city'], data)
temps = map(lambda x: x['temp'], data)
得到输出结果为:
<map object at 0x000002216FDA4E48>
<map object at 0x000002216FDA4F98>
得知
这种情况是因为在python3里面,map()的返回值已经不再是list,而是iterators, 所以想要使用,只用将iterator 转换成list 即可, 比如 list(map()) 。
作者:QQ595454159
链接:https://www.imooc.com/article/42696
来源:慕课网
感谢大佬\0.0/!
然后改为:
cities = list(map(lambda x: x['city'], data))
temps = list(map(lambda x: x['temp'], data))