matplotlib.pyplot.colormaps色彩图cmap
cmap常用于改变绘制风格,如黑白gray,翠绿色virdidis

一、问题
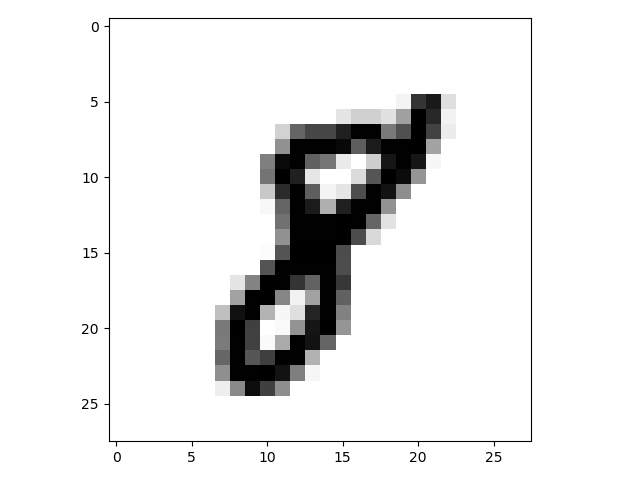
使用plt.imshow时常用不同的颜色,如plt.imshow(images, cmap=plt.get_cmap(‘gray_r’))是白底黑字的
import numpy as np
import matplotlib.pyplot as plt
x = np.array([0,0,0,0,0,0,0,0,0,0,0,0,0,0,0,0,0,0,0,0,0,0,0,0,0,0,0,0,0,0,0,0,0,0,0,0,0,0,0,0,0,0,0,0,0,0,0,0,0,0,0,0,0,0,0,0,0,0,0,0,0,0,0,0,0,0,0,0,0,0,0,0,0,0,0,0,0,0,0,0,0,0,0,0,0,0,0,0,0,0,0,0,0,0,0,0,0,0,0,0,0,0,0,0,0,0,0,0,0,0,0,0,0,0,0,0,0,0,0,0,0,0,0,0,0,0,0,0,0,0,0,0,0,0,0,0,0,0,0,0,0,0,0,0,0,0,0,0,0,0,0,0,0,0,0,0,0,0,0,11,203,229,32,0,0,0,0,0,0,0,0,0,0,0,0,0,0,0,0,0,0,0,0,26,47,47,30,95,254,215,13,0,0,0,0,0,0,0,0,0,0,0,0,0,0,0,0,45,154,185,185,223,253,253,133,175,255,188,19,0,0,0,0,0,0,0,0,0,0,0,0,0,0,0,0,110,253,253,253,246,161,228,253,253,254,92,0,0,0,0,0,0,0,0,0,0,0,0,0,0,0,0,128,245,253,158,137,21,0,48,233,253,233,8,0,0,0,0,0,0,0,0,0,0,0,0,0,0,0,0,139,254,223,25,0,0,36,170,254,244,106,0,0,0,0,0,0,0,0,0,0,0,0,0,0,0,0,0,55,212,253,161,11,26,178,253,236,113,0,0,0,0,0,0,0,0,0,0,0,0,0,0,0,0,0,0,7,155,253,228,80,223,253,253,109,0,0,0,0,0,0,0,0,0,0,0,0,0,0,0,0,0,0,0,0,141,253,253,253,254,253,154,29,0,0,0,0,0,0,0,0,0,0,0,0,0,0,0,0,0,0,0,0,110,253,253,253,254,179,38,0,0,0,0,0,0,0,0,0,0,0,0,0,0,0,0,0,0,0,0,3,171,254,254,254,179,0,0,0,0,0,0,0,0,0,0,0,0,0,0,0,0,0,0,0,0,0,0,171,253,253,253,253,178,0,0,0,0,0,0,0,0,0,0,0,0,0,0,0,0,0,0,0,0,26,123,254,253,203,156,253,200,0,0,0,0,0,0,0,0,0,0,0,0,0,0,0,0,0,0,0,0,93,253,254,121,13,93,253,158,0,0,0,0,0,0,0,0,0,0,0,0,0,0,0,0,0,0,0,64,239,253,76,8,32,219,253,126,0,0,0,0,0,0,0,0,0,0,0,0,0,0,0,0,0,0,0,133,254,191,0,5,108,234,254,106,0,0,0,0,0,0,0,0,0,0,0,0,0,0,0,0,0,0,0,132,253,190,5,85,253,236,154,0,0,0,0,0,0,0,0,0,0,0,0,0,0,0,0,0,0,0,0,153,253,169,192,253,253,77,0,0,0,0,0,0,0,0,0,0,0,0,0,0,0,0,0,0,0,0,0,112,253,253,254,236,129,9,0,0,0,0,0,0,0,0,0,0,0,0,0,0,0,0,0,0,0,0,0,17,118,243,191,113,0,0,0,0,0,0,0,0,0,0,0,0,0,0,0,0,0,0,0,0,0,0,0,0,0,0,0,0,0,0,0,0,0,0,0,0,0,0,0,0,0,0,0,0,0,0,0,0,0,0,0,0,0,0,0,0,0,0,0,0,0,0,0,0,0,0,0,0,0,0,0,0,0,0,0,0,0,0,0,0,0,0,0,0,0,0,0,0,0,0,0,0,0,0,0,0,0,0,0,0])
image = x.reshape([28, 28])
cmap = 'gray_r'
plt.imshow(image, cmap=plt.get_cmap(cmap))
plt.show()
这个cmap指的是colormaps,色彩图。
二、类别(色彩映射范围)
-
Diverging:发散。改变两种不同颜色的亮度和饱和度,这些颜色在中间以不饱和的颜色相遇;当绘制的信息具有关键中间值(例如地形)或数据偏离零时,应使用此值。

-
Cyclic:循环。改变两种不同颜色的亮度,在中间和开始/结束时以不饱和的颜色相遇。应该用于在端点处环绕的值,例如相角,风向或一天中的时间。

三、测试代码
import numpy as np
import matplotlib.pyplot as plt
from collections import OrderedDict

cmaps = OrderedDict()

'''将颜色替换此处'''
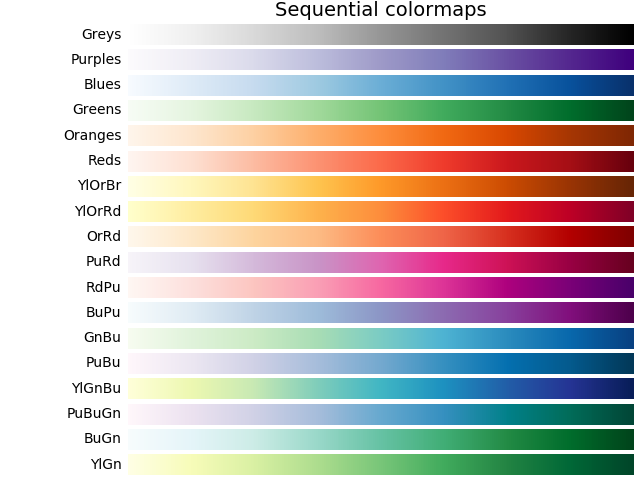
cmaps['Sequential'] = [
            'Greys', 'Purples', 'Blues', 'Greens', 'Oranges', 'Reds',
            'YlOrBr', 'YlOrRd', 'OrRd', 'PuRd', 'RdPu', 'BuPu',
            'GnBu', 'PuBu', 'YlGnBu', 'PuBuGn', 'BuGn', 'YlGn']
'''将颜色替换此处'''

print(cmaps.items())

nrows = max(len(cmap_list) for cmap_category, cmap_list in cmaps.items())
gradient = np.linspace(0, 1, 256)
gradient = np.vstack((gradient, gradient))


def plot_color_gradients(cmap_category, cmap_list, nrows):
    fig, axes = plt.subplots(nrows=nrows)
    fig.subplots_adjust(top=0.95, bottom=0.01, left=0.2, right=0.99)
    axes[0].set_title(cmap_category + ' colormaps', fontsize=14)

    for ax, name in zip(axes, cmap_list):
        ax.imshow(gradient, aspect='auto', cmap=plt.get_cmap(name))
        pos = list(ax.get_position().bounds)
        x_text = pos[0] - 0.01
        y_text = pos[1] + pos[3]/2.
        fig.text(x_text, y_text, name, va='center', ha='right', fontsize=10)

    # Turn off *all* ticks & spines, not just the ones with colormaps.
    for ax in axes:
        ax.set_axis_off()


for cmap_category, cmap_list in cmaps.items():
    plot_color_gradients(cmap_category, cmap_list, nrows)

plt.show()
四、具体划分
- Sequential
cmaps['Perceptually Uniform Sequential'] = [
            'viridis', 'plasma', 'inferno', 'magma', 'cividis']
cmaps['Sequential'] = [
            'Greys', 'Purples', 'Blues', 'Greens', 'Oranges', 'Reds',
            'YlOrBr', 'YlOrRd', 'OrRd', 'PuRd', 'RdPu', 'BuPu',
            'GnBu', 'PuBu', 'YlGnBu', 'PuBuGn', 'BuGn', 'YlGn']
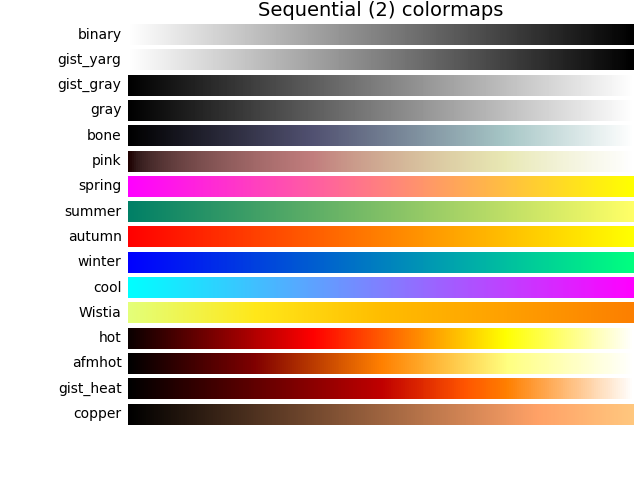
- Sequential2
cmaps['Sequential (2)'] = [
            'binary', 'gist_yarg', 'gist_gray', 'gray', 'bone', 'pink',
            'spring', 'summer', 'autumn', 'winter', 'cool', 'Wistia',
            'hot', 'afmhot', 'gist_heat', 'copper']
- Diverging
cmaps['Diverging'] = [
            'PiYG', 'PRGn', 'BrBG', 'PuOr', 'RdGy', 'RdBu',
            'RdYlBu', 'RdYlGn', 'Spectral', 'coolwarm', 'bwr', 'seismic']
- Cyclic
cmaps['Cyclic'] = ['twilight', 'twilight_shifted', 'hsv']
- Qualitative
cmaps['Qualitative'] = ['Pastel1', 'Pastel2', 'Paired', 'Accent',
                        'Dark2', 'Set1', 'Set2', 'Set3',
                        'tab10', 'tab20', 'tab20b', 'tab20c']
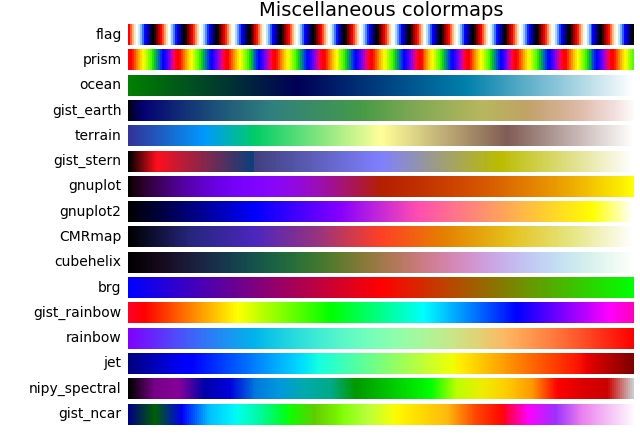
- Miscellaneous
cmaps['Miscellaneous'] = [
            'flag', 'prism', 'ocean', 'gist_earth', 'terrain', 'gist_stern',
            'gnuplot', 'gnuplot2', 'CMRmap', 'cubehelix', 'brg',
            'gist_rainbow', 'rainbow', 'jet', 'nipy_spectral', 'gist_ncar']
五、色彩图亮度值
import numpy as np
import matplotlib as mpl
import matplotlib.pyplot as plt
from matplotlib import cm
from colorspacious import cspace_converter
from collections import OrderedDict

cmaps = OrderedDict()

'''将颜色替换此处'''
cmaps['Sequential'] = [
            'Greys', 'Purples', 'Blues', 'Greens', 'Oranges', 'Reds',
            'YlOrBr', 'YlOrRd', 'OrRd', 'PuRd', 'RdPu', 'BuPu',
            'GnBu', 'PuBu', 'YlGnBu', 'PuBuGn', 'BuGn', 'YlGn']
'''将颜色替换此处'''

mpl.rcParams.update({'font.size': 12})

# Number of colormap per subplot for particular cmap categories
_DSUBS = {'Perceptually Uniform Sequential': 5, 'Sequential': 6,
          'Sequential (2)': 6, 'Diverging': 6, 'Cyclic': 3,
          'Qualitative': 4, 'Miscellaneous': 6}

# Spacing between the colormaps of a subplot
_DC = {'Perceptually Uniform Sequential': 1.4, 'Sequential': 0.7,
       'Sequential (2)': 1.4, 'Diverging': 1.4, 'Cyclic': 1.4,
       'Qualitative': 1.4, 'Miscellaneous': 1.4}

# Indices to step through colormap
x = np.linspace(0.0, 1.0, 100)

# Do plot
for cmap_category, cmap_list in cmaps.items():

    # Do subplots so that colormaps have enough space.
    # Default is 6 colormaps per subplot.
    dsub = _DSUBS.get(cmap_category, 6)
    nsubplots = int(np.ceil(len(cmap_list) / dsub))

    # squeeze=False to handle similarly the case of a single subplot
    fig, axes = plt.subplots(nrows=nsubplots, squeeze=False,
                             figsize=(7, 2.6*nsubplots))

    for i, ax in enumerate(axes.flat):

        locs = []  # locations for text labels

        for j, cmap in enumerate(cmap_list[i*dsub:(i+1)*dsub]):

            # Get RGB values for colormap and convert the colormap in
            # CAM02-UCS colorspace.  lab[0, :, 0] is the lightness.
            rgb = cm.get_cmap(cmap)(x)[np.newaxis, :, :3]
            lab = cspace_converter("sRGB1", "CAM02-UCS")(rgb)

            # Plot colormap L values.  Do separately for each category
            # so each plot can be pretty.  To make scatter markers change
            # color along plot:
            # http://stackoverflow.com/questions/8202605/

            if cmap_category == 'Sequential':
                # These colormaps all start at high lightness but we want them
                # reversed to look nice in the plot, so reverse the order.
                y_ = lab[0, ::-1, 0]
                c_ = x[::-1]
            else:
                y_ = lab[0, :, 0]
                c_ = x

            dc = _DC.get(cmap_category, 1.4)  # cmaps horizontal spacing
            ax.scatter(x + j*dc, y_, c=c_, cmap=cmap, s=300, linewidths=0.0)

            # Store locations for colormap labels
            if cmap_category in ('Perceptually Uniform Sequential',
                                 'Sequential'):
                locs.append(x[-1] + j*dc)
            elif cmap_category in ('Diverging', 'Qualitative', 'Cyclic',
                                   'Miscellaneous', 'Sequential (2)'):
                locs.append(x[int(x.size/2.)] + j*dc)

        # Set up the axis limits:
        #   * the 1st subplot is used as a reference for the x-axis limits
        #   * lightness values goes from 0 to 100 (y-axis limits)
        ax.set_xlim(axes[0, 0].get_xlim())
        ax.set_ylim(0.0, 100.0)

        # Set up labels for colormaps
        ax.xaxis.set_ticks_position('top')
        ticker = mpl.ticker.FixedLocator(locs)
        ax.xaxis.set_major_locator(ticker)
        formatter = mpl.ticker.FixedFormatter(cmap_list[i*dsub:(i+1)*dsub])
        ax.xaxis.set_major_formatter(formatter)
        ax.xaxis.set_tick_params(rotation=50)

    ax.set_xlabel(cmap_category + ' colormaps', fontsize=14)
    fig.text(0.0, 0.55, 'Lightness $L^*$', fontsize=12,
             transform=fig.transFigure, rotation=90)

    fig.tight_layout(h_pad=0.0, pad=1.5)
    plt.show()
六、灰度转换
要注意转换为彩色图的灰度,因为它们可以打印在黑白打印机上。如果不仔细考虑,您的读者可能会得到无法辨认的情节,因为灰度会通过色彩映射无法预测地发生变化。
import numpy as np
import matplotlib as mpl
import matplotlib.pyplot as plt
from matplotlib import cm
from colorspacious import cspace_converter
from collections import OrderedDict

cmaps = OrderedDict()

'''将颜色替换此处'''
cmaps['Sequential'] = [
            'Greys', 'Purples', 'Blues', 'Greens', 'Oranges', 'Reds',
            'YlOrBr', 'YlOrRd', 'OrRd', 'PuRd', 'RdPu', 'BuPu',
            'GnBu', 'PuBu', 'YlGnBu', 'PuBuGn', 'BuGn', 'YlGn']
'''将颜色替换此处'''

mpl.rcParams.update({'font.size': 14})

# Indices to step through colormap.
x = np.linspace(0.0, 1.0, 100)

gradient = np.linspace(0, 1, 256)
gradient = np.vstack((gradient, gradient))


def plot_color_gradients(cmap_category, cmap_list):
    fig, axes = plt.subplots(nrows=len(cmap_list), ncols=2)
    fig.subplots_adjust(top=0.95, bottom=0.01, left=0.2, right=0.99,
                        wspace=0.05)
    fig.suptitle(cmap_category + ' colormaps', fontsize=14, y=1.0, x=0.6)

    for ax, name in zip(axes, cmap_list):

        # Get RGB values for colormap.
        rgb = cm.get_cmap(plt.get_cmap(name))(x)[np.newaxis, :, :3]

        # Get colormap in CAM02-UCS colorspace. We want the lightness.
        lab = cspace_converter("sRGB1", "CAM02-UCS")(rgb)
        L = lab[0, :, 0]
        L = np.float32(np.vstack((L, L, L)))

        ax[0].imshow(gradient, aspect='auto', cmap=plt.get_cmap(name))
        ax[1].imshow(L, aspect='auto', cmap='binary_r', vmin=0., vmax=100.)
        pos = list(ax[0].get_position().bounds)
        x_text = pos[0] - 0.01
        y_text = pos[1] + pos[3]/2.
        fig.text(x_text, y_text, name, va='center', ha='right', fontsize=10)

    # Turn off *all* ticks & spines, not just the ones with colormaps.
    for ax in axes.flat:
        ax.set_axis_off()

    plt.show()


for cmap_category, cmap_list in cmaps.items():
    plot_color_gradients(cmap_category, cmap_list)
七、色觉缺陷
有许多关于色盲的信息(例如,[色盲])。 另外,有一些工具可用于将图像转换成它们如何寻找不同类型的色觉缺陷(例如,[vischeck])。
最常见的色觉缺陷形式包括区分红色和绿色。 因此,避免使用红色和绿色的色图将一般避免许多问题。
八、颜色替换
九、参考文献
- Choosing Colormaps in Matplotlib


