single cell 基础笔记(一)
课程地址 https://hemberg-lab.github.io/scRNA.seq.course/index.html
2 Introduction to single-cell RNA-seq
2.5 Challenges
sequencing libraries 即 different cells
The main sources of discrepancy between the libraries are:
Amplification (up to 1 million fold)
Gene ‘dropouts’ in which a gene is observed at a moderate expression level
in one cell but is not detected in another cell (Kharchenko, Silberstein, and Scadden 2014).
libraries之间的差别主要来自于:RNA规模(扩增效率)的不同及gene dropouts(基因子啊有些cell中表达值缺失)
In both cases the discrepancies are introduced due to low starting
amounts of transcripts since the RNA comes from one cell only.
Improving the transcript capture efficiency and reducing the
amplification bias are currently active areas of research. However, as
we shall see in this course, it is possible to alleviate some of these
issues through proper normalization and corrections.
差异是由于一个cell转录起始量较低。
提高转录捕获效率(transcript capture efficiency)及减少放大偏差(amplification bias)
通过适当的标准化及纠正,也可以缓解这些问题。
2.7 What platform to use for my experiment?
For example, if one is interested in characterizing the composition of
a tissue, then a droplet-based method which will allow a very large
number of cells to be captured is likely to be the most appropriate.
On the other hand, if one is interesting in characterizing a rare
cell-population for which there is a known surface marker, then it is
probably best to enrich using FACS and then sequence a smaller number
of cells.
单细胞测序的对照 https://www.sohu.com/a/122201336_390793
为了更好估计和消除单细胞测序文库间的技术(系统)误差,现有两种定量标准被广泛采用,即spike-ins和UMIs。使用这两种对照是为了辅助规范(normalization)不同细胞间的基因表达水平。
Spike-ins
Spike-ins是已知浓度的外源RNA分子。在单细胞裂解液中加入Spke-ins后,再进行反转录。最广泛使用的Spike-ins是External
RNA Control Consortium (ERCC)提供的合成spikes。其包含96个不同长度和GC含量的mRNA分子 (Jiang et al. 2011)。
但是spike-ins的使用浓度通常很高,结果会占据很大比例的测序reads。最新的Drop-seq技术也还没不能加入spike-ins。
UMIs
另一种标准化方法是使用 Unique Molecular Identifiers (UMIs)(Kivioja et al. 2012).
UMIs是一种随机条形码(barcode)序列,长度在4-20 bp之间。
在扩增步骤之前(通常在反转录期间),UMIs被添加在每个转录本cDNA的3’或5’端。之后,对转录本末端进行靶向测序。这些barcodes使得在扩增步骤之前,可以对转录本进行定量。虽然UMIs消除扩增偏好性的效果非常好,但是不合适用于研究基因异构体和allel特异表达。
4 Construction of expression matrix
The output from a scRNA-seq experiment is a large collection of cDNA reads.
scRNA-seq 实验得到的是cDNA reads 数据,需要进行QC(quality control)等处理。
4.6 Unique Molecular Identifiers (UMIs)
4.6.1 Introduction
Unique Molecular Identifiers are short (4-10bp) random barcodes added
to transcripts during reverse-transcription. They enable sequencing
reads to be assigned to individual transcript molecules and thus the
removal of amplification noise and biases from scRNASeq data.
When sequencing UMI containing data, techniques are used to
specifically sequence only the end of the transcript containing the
UMI (usually the 3’ end).
7 Cleaning the Expression Matrix
7.1 Expression QC (UMI)
7.1.3 Cell QC
7.1.3.1 Library size
Next we consider the total number of RNA molecules detected per sample
(if we were using read counts rather than UMI counts this would be the
total number of reads). Wells with few reads/molecules are likely to
have been broken or failed to capture a cell, and should thus be removed.
cell中 UMI counts/reads 总数较少的删除
7.1.3.2 Detected genes
In addition to ensuring sufficient sequencing depth for each sample,
we also want to make sure that the reads are distributed across the
transcriptome. Thus, we count the total number of unique genes
detected in each sample.
cell中检测到的 unique genes 总数较少的删除
7.1.3.3 ERCCs and MTs
Another measure of cell quality is the ratio between ERCC spike-in
RNAs and endogenous RNAs. This ratio can be used to estimate the total
amount of RNA in the captured cells. Cells with a high level of
spike-in RNAs had low starting amounts of RNA, likely due to the cell
being dead or stressed which may result in the RNA being degraded.
spike-in RNAs和线粒体(MT)RNAs 所占比例。
spike-in RNAs 水平高的cells,RNA起始总数低,可能是由于细胞死亡或者stressed使RNA降解。
7.1.6 Gene analysis
7.1.6.2 Gene filtering
It is typically a good idea to remove genes whose expression level is
considered “undetectable”. We define a gene as detectable if at least
two cells contain more than 1 transcript from the gene. If we were
considering read counts rather than UMI counts a reasonable threshold
is to require at least five reads in at least two cells. However, in
both cases the threshold strongly depends on the sequencing depth. It
is important to keep in mind that genes must be filtered after cell
filtering since some genes may only be detected in poor quality cells
genes过滤必须在cell过滤之后进行,因为一些基因可能只在poor quality cells 中检测到。
7.3 Data visualization
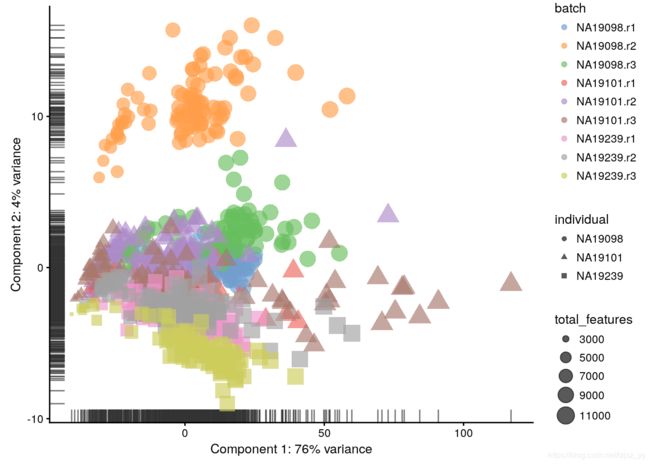
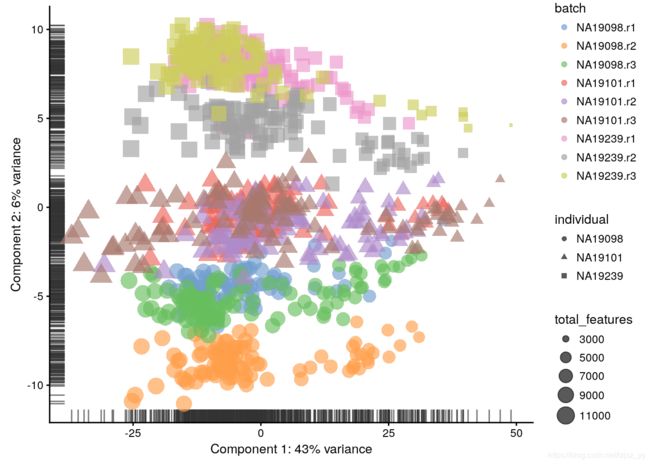
7.3.1 Introduction 批处理影响
One important aspect of single-cell RNA-seq is to control for batch
effects. Batch effects are technical artefacts that are added to the
samples during handling. For example, if two sets of samples were
prepared in different labs or even on different days in the same lab,
then we may observe greater similarities between the samples that were
handled together. In the worst case scenario, batch effects may be
mistaken for true biological variation. The Tung data allows us to
explore these issues in a controlled manner since some of the salient
aspects of how the samples were handled have been recorded. Ideally,
we expect to see batches from the same individual grouping together
and distinct groups corresponding to each individual.
单细胞RNA-seq的一个重要方面是控制批处理效果。批处理效果是在处理过程中添加到样本中的技术人工制品。
同一批处理的样本之间有很强的相似性,会对实验造成影响。
理想情况下,我们希望,来自相同的个体的批分组在一起,不同分组对应于每个个体。
7.3.2 PCA plot
最简单方法:PCA分析后,可视化前两个principal components。
Mathematically, the PCs correspond to the eigenvectors of the
covariance matrix. The eigenvectors are sorted by eigenvalue so that
the first principal component accounts for as much of the variability
in the data as possible, and each succeeding component in turn has the
highest variance possible under the constraint that it is orthogonal
to the preceding components
在数学上,PC对应于协方差矩阵的特征向量。 特征向量按特征值排序,因此第一主成分尽可能地考虑数据的可变性,并且每个后续成分在与前面的成分正交的约束下具有最高的方差。
before QC
log-transformation 对数变换:


log-transformation reduces the variance on the first principal component and already
separates some biological effects. Moreover, it makes the distribution
of the expression values more normal.
7.3.3 tSNE map
tSNE (t-Distributed Stochastic Neighbor Embedding) combines
dimensionality reduction (e.g. PCA) with random walks on the
nearest-neighbour network to map high dimensional data to a
2-dimensional space while preserving local distances between cells.
tSNE 是一种随机算法(stochastic algorithm),每次plot结果不同。
perplexity 困惑度: the number of neighbours used to build the nearest-neighbour network。值大稠密,值小稀疏。
7.5 Identifying confounding factors 混淆因子
其中一些变量与任何PC相关
Explanatory variables 解释变量
7.7 Normalization theory
7.7.2 Library size
Many methods to correct for library size have been developped for bulk
RNA-seq and can be equally applied to scRNA-seq (eg. UQ, SF, CPM,
RPKM, FPKM, TPM).
对于批量RNA-seq,已经开发了许多方法来校正库大小,这些方法同样适用于scRNA-seq。如 UQ, SF, CPM, RPKM, FPKM, TPM。
7.7.3.1 CPM(counts per million)
The simplest way to normalize this data is to convert it to counts per
million (CPM) by dividing each column by its total then multiplying by
1,000,000. Note that spike-ins should be excluded from the calculation
of total expression in order to correct for total cell RNA content,
therefore we will only use endogenous genes.
Note RPKM, FPKM and TPM are variants on CPM which further adjust
counts by the length of the respective gene/transcript.
7.7.3.2 RLE (SF:size factor)
First the geometric mean of each gene across all cells is calculated.
The size factor for each cell is the median across genes of the ratio
of the expression to the gene’s geometric mean. A drawback to this
method is that since it uses the geometric mean only genes with
non-zero expression values across all cells can be used in its
calculation, making it unadvisable for large low-depth scRNASeq
experiments.
7.7.3.3 UQ(upperquartile)
Here each column is divided by the 75% quantile of the counts for each
library. Often the calculated quantile is scaled by the median across
cells to keep the absolute level of expression relatively consistent.
A drawback to this method is that for low-depth scRNASeq experiments
the large number of undetected genes may result in the 75% quantile
being zero (or close to it). This limitation can be overcome by
generalizing the idea and using a higher quantile (eg. the 99%
quantile is the default in scater) or by excluding zeros prior to
calculating the 75% quantile.
7.7.3.4 TMM
The M-values in question are the gene-wise log2 fold changes between
individual cells. One cell is used as the reference then the M-values
for each other cell is calculated compared to this reference. These
values are then trimmed by removing the top and bottom ~30%, and the
average of the remaining values is calculated by weighting them to
account for the effect of the log scale on variance. Each
non-reference cell is multiplied by the calculated factor. Two
potential issues with this method are insufficient non-zero genes left
after trimming, and the assumption that most genes are not
differentially expressed.
7.7.3.5 scran
Briefly this method deals with the problem of vary large numbers of
zero values per cell by pooling cells together calculating a
normalization factor (similar to CPM) for the sum of each pool. Since
each cell is found in many different pools, cell-specific factors can
be deconvoluted from the collection of pool-specific factors using
linear algebra.
7.7.3.6 Downsampling
A final way to correct for library size is to downsample the
expression matrix so that each cell has approximately the same total
number of molecules. The benefit of this method is that zero values
will be introduced by the down sampling thus eliminating any biases
due to differing numbers of detected genes. However, the major
drawback is that the process is not deterministic so each time the
downsampling is run the resulting expression matrix is slightly
different. Thus, often analyses must be run on multiple downsamplings
to ensure results are robust.
7.10 Dealing with confounders
7.10.2 Remove Unwanted Variation
7.10.2.1 RUVg
7.10.2.2 RUVs
7.10.3 Combat
7.10.4 mnnCorrect
7.10.5 GLM

