Python matplotlib函数
1、Matplotlib提供了以下功能:
cla()   # Clear axis
clf()   # Clear figure
close() # Close a figure window
2、绘制树
import matplotlib.pyplot as plt


#定义文本框与箭头格式
decisionNode = dict(boxstyle="sawtooth", fc="0.8")
leafNode = dict(boxstyle="round4", fc="0.8")
arrow_args = dict(arrowstyle="<-")

#绘制带箭头的注释
def plotNode(nodeTxt, centerPt, parentPt, nodeType):
    # nodeTxt为要显示的文本,centerNode为文本中心点, nodeType为箭头所在的点, parentPt为指向文本的点
    createPlot.ax1.annotate(nodeTxt, xy=parentPt, xycoords='axes fraction',
                             xytext=centerPt, textcoords='axes fraction',
                              va='center', ha='center', bbox=nodeType, arrowprops=arrow_args)

def createPlot():
     fig = plt.figure(1, facecolor='white') # 新建一个画布,背景设置为白色的
     fig.clf() # 将画图清空
     # createPlot.ax1为全局变量,绘制图像句柄
    # frameon表示是否绘制坐标轴矩形
     createPlot.ax1 = plt.subplot(111, frameon=False) # 设置一个多图展示,但是设置多图只有一个
     plotNode('a decision node', (0.5, 0.1), (0.1, 0.5), decisionNode)
     plotNode('a leaf node', (0.8, 0.1), (0.3, 0.8), leafNode)
     plt.show()

createPlot()
1).实例代码的结构
- 有两个函数 plotNode()、createPlot()。 plotNode()函数用于画节点
createPlot()函数用于画图 decisionNode、leafNode和arrow_args是定义的三个全局变量,分别表示的是三个基本元素。decisionNode和leafNode在createPlot()函数调用plotNode()的时候作为参数。arrow_args是用来画箭头的- 最后一行,调用
createPlot()
3.函数讲解
- 先看plotNode()
plotNode函数有nodeTxt,centerPt,parentPt,nodeType这四个参数。nodeTxt用于记录nodeTxt,即节点的文本信息。centerPt表示那个节点框的位置。parentPt表示那个箭头的起始位置。nodeType表示的是节点的类型,也就会用我们之前定义的全局变量。
可能迷惑:createPlot.ax1 怎么回事?怎么突然跑出来了?
解答:在createPlot中第三行createPlot.ax1 = plt.subplot(111, frameon=False)进行了创建。意思是这个只是一个新框。annotate是注释的意思,也就是作为原来那个框的注释,也是添加一些新的东西。
- 再看createPlot()
fig = plt.figure(1, facecolor='white')实现了画布创建,并且背景是白色的
之后就是清除画布,并创建多图展示,但是设置参数是1,构建了一个1*1的模块,并操作对象指向第一个图。
然后就是调用plotNode函数了,进行画点。
plt.show()用于展示画图
4.参数意义:
- boxstyle是文本框类型
- sawtooth是锯齿图文框
- round4是圆一点的四边形(见图)
- arrowstyle是设置箭头类型
文档显示 Axes.annotate(*args, **kwargs)xy是终点坐标xytext是起点坐标
参考:https://www.jianshu.com/p/438807636568
3、绘制形状 matplotlib.patches
1).plt.gca().add_patch()
注意,创建的图形对象不会直接在 figure 中显示,需要添加进 axis。
import matplotlib
import matplotlib.pyplot as plt
from matplotlib.patches import Wedge
a = Wedge((.5, .5), .5, 0, 360, width=.25, color='red')
plt.gca().add_patch(a)
plt.axis('equal')
plt.axis('off')
plt.show()
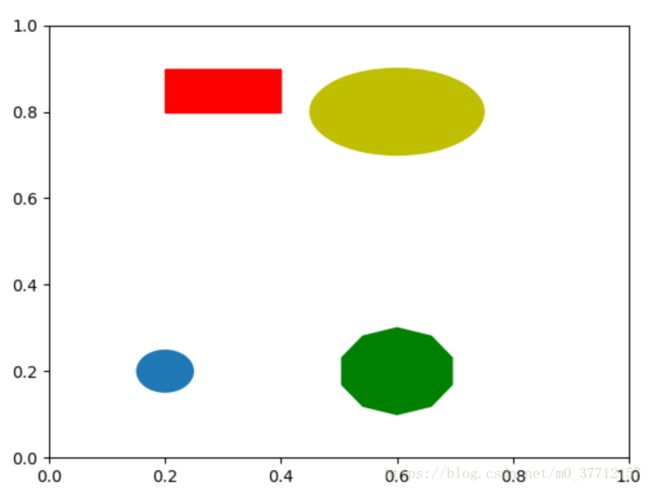
2)各种图形绘图
import numpy as np
import matplotlib.pyplot as plt
import matplotlib.patches as mpatches


fig, ax = plt.subplots()
xy1 = np.array([0.2 , 0.2])
xy2 = np.array([0.2, 0.8])
xy3 = np.array([0.6 , 0.2])
xy4 = np.array([0.6, 0.8])
print(xy1)
circle = mpatches.Circle(xy1 , 0.05)
ax.add_patch(circle)

rect = mpatches.Rectangle(xy2 , 0.2 , 0.1 , color='r')
ax.add_patch(rect)

polygon = mpatches.RegularPolygon(xy3 , 10 , 0.1, color='g') # arg1-4 : position , regular nums , radius , color
ax.add_patch(polygon)

ellipse = mpatches.Ellipse(xy4, 0.3 , 0.2 , color='y')  # arg1-4 : position , log radius , short radius , color
ax.add_patch(ellipse)
#ax.axis('equal') # circle , otherwise
plt.show()
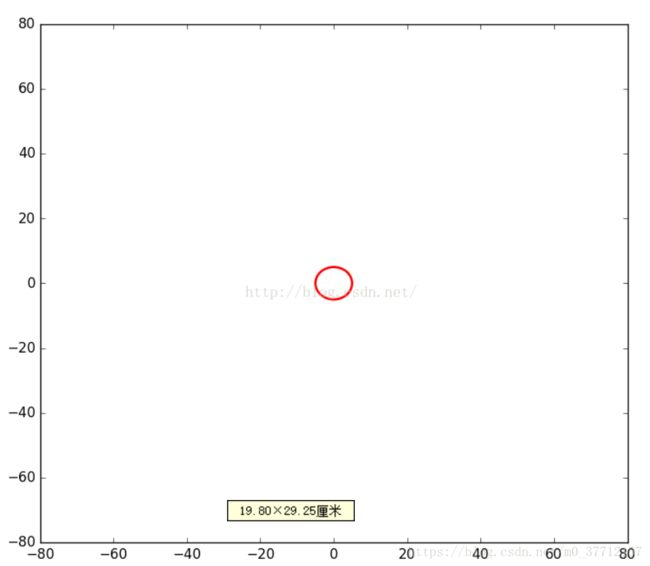
3)、空心圆
import matplotlib.pyplot as plt
import matplotlib.patches as mpatches
import numpy as np
circle_target = mpatches.Circle([0, 0], radius=5, edgecolor='r', fill=False)
plt.xlim(-80, 80)
plt.ylim(-80, 80)
plt.axes().add_patch(circle_target)


