SQL优化连弹四之show profile
MySQL从5.0.37版本开始增加了对show profiles和show profile语句的支持。
是否支持
mysql> select @@have_profiling;
+------------------+
| @@have_profiling |
+------------------+
| YES              |
+------------------+
1 row in set, 1 warning (0.00 sec)
开启
mysql> select @@profiling;
+-------------+
| @@profiling |
+-------------+
|           0 |
+-------------+
1 row in set, 1 warning (0.00 sec)
show profiles
select * from customer where customer_id=1 or store_id=1;

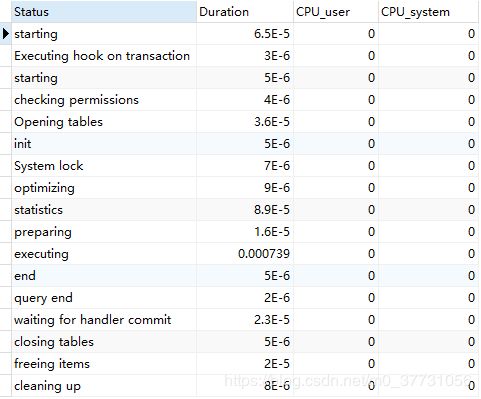
show profile for query
通过show query for query语句能看到执行过程中线程的每个状态和消耗时间。
show PROFILE for query 3;

在获取到最消耗时间的线程状态后,Mysql支持进一步选择all、cpu、block io、context switch、page faults等明细类型来查看MySQL在使用什么资源上耗费了过高的时间。
show profile cpu for query 30;
如果对MySQL源码感兴趣,还可以通过show profile source for query查看SQL解析执行过程中每个步骤对应的源码文件、函数名以及具体的源文件行数:

更多讲解,欢迎关注我的github:
go成神之路