文章目录
- Numpy简介
- 散点图
- 折线图
- 条形图
- 直方图
- 饼状图
- 箱型图
- 颜色和样式
- 面向对象
- 子图
- 多图
- 网格
- 图例
Numpy简介
median=np.median(c)
variance=np.var(c)
c_slice=c[2:5]
c1=np.zeros((2,3))
c2=np.arange(10)
x=np.loadtxt('000001.csv',delimiter=',',skiprows=1,usecols=(1,4,6),unpack=False)
o,c,v=np.loadtxt('000001.csv',delimiter=',',skiprows=1,usecols=(1,4,6),unpack=True)
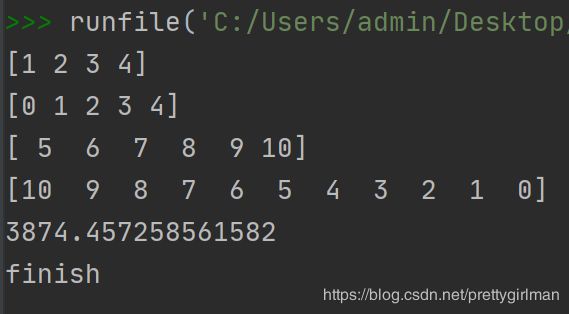
vwap=np.average(c,weights=v)
print(vwap)
print("finish")
散点图
import numpy as np
import matplotlib.pyplot as plt

height=[161,170,182,175,173,165]
weight=[50,58,80,70,69,55]

plt.scatter(height,weight)

plt.show()

N=1000
x=np.random.randn(N)
y1=np.random.randn(len(x))

plt.scatter(x,y1)

plt.show()

y2=x+np.random.randn(len(x))*0.1
plt.scatter(x,y2)

y3=-1*x+np.random.randn(len(x))*0.1
plt.scatter(x,y3)

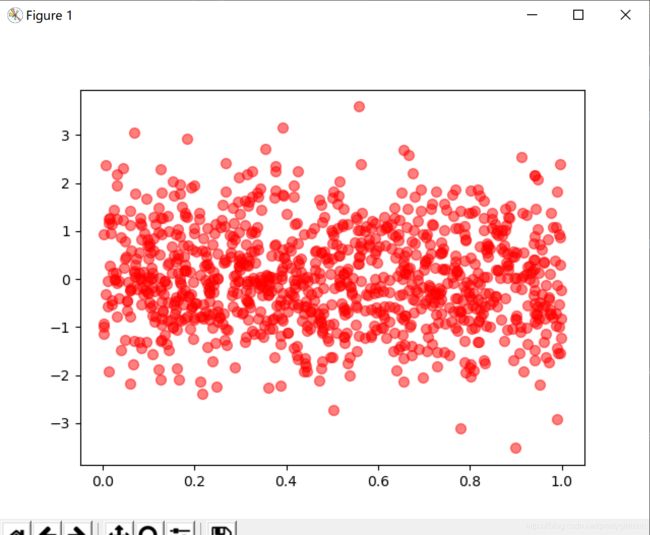
N = 1000
x = np.random.rand(N)
y = np.random.rand(N)


open,close=np.loadtxt('000001.csv',delimiter=',',skiprows=1,usecols=(1,4),unpack=True)

change=close-open

yesterday=change[:-1]
today=change[1:]

plt.scatter(today,yesterday)

plt.show()

s=200
marker='v'
c='green'
alpha=1

plt.scatter(x, y1, s=50, marker='o', c='red', alpha=0.5)

plt.show()

open,close=np.loadtxt('000001.csv',delimiter=',',skiprows=1,usecols=(1,4),unpack=True)

change=close-open

yesterday=change[:-1]
today=change[1:]

plt.scatter(yesterday,today,s=500,c='r',alpha=1)

plt.show()
折线图
import numpy as np
import matplotlib.pyplot as plt
import matplotlib.dates as mdates

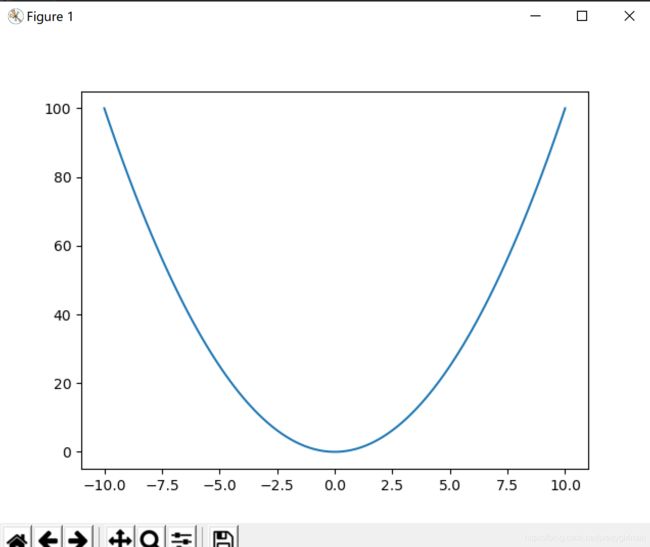
x=np.linspace(-10,10,100)
y=x**2
plt.plot(x,y)
plt.show()


date,open,close=np.loadtxt('000001.csv',delimiter=',',
                           converters={0:mdates.strpdate2num('%m/%d/%Y')},skiprows=1,usecols=(0,1,4),unpack=True)


plt.plot_date(date,close,'y-')

plt.show()

plt.plot_date(date,close,'go')

plt.plot_date(date,close,'r--')

plt.show()

plt.plot(date, close, color='green', linestyle='dashed', marker='o',
     markerfacecolor='blue', markersize=12)

plt.show()
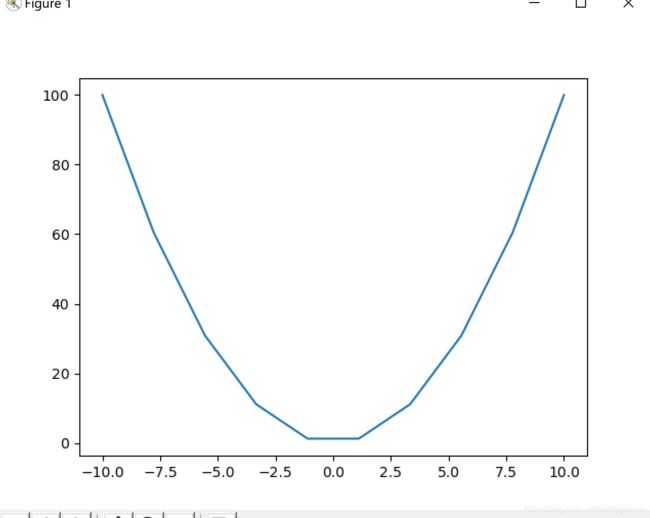
x=np.linspace(-10,10,10)分成十份
条形图
import numpy as np
import matplotlib.pyplot as plt

N=5

y=[20,10,30,25,15]

index = np.arange(N)

p1 = plt.bar(x=index, height=y,width=0.5,bottom=100,color='red')

plt.show()

p2 = plt.bar(x=0, bottom=index, width=y,height=0.5,orientation='horizontal')

plt.show()

p3=plt.barh(bottom=index,width=y,height=0.5)

plt.show()

index=np.arange(4)

sales_BJ=[52,55,63,53]
sales_SH=[44,66,55,41]

bar_width=0.3

plt.bar(index,sales_BJ,bar_width,color='b')
plt.bar(index+bar_width,sales_SH,bar_width,color='r')
plt.show()

plt.bar(index,sales_BJ,bar_width,color='b')
plt.bar(index,sales_SH,bar_width,color='r',bottom=sales_BJ)
plt.show()
直方图
import numpy as np
import matplotlib.pyplot as plt
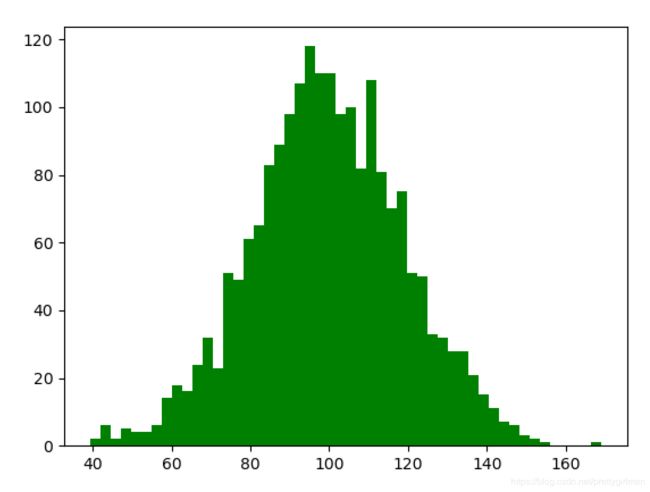
mu = 100
sigma = 20
x = mu + sigma * np.random.randn(2000)
plt.hist(x, bins=10,color='red',density=True)
plt.hist(x, bins=50,color='green',density=False)
plt.show()
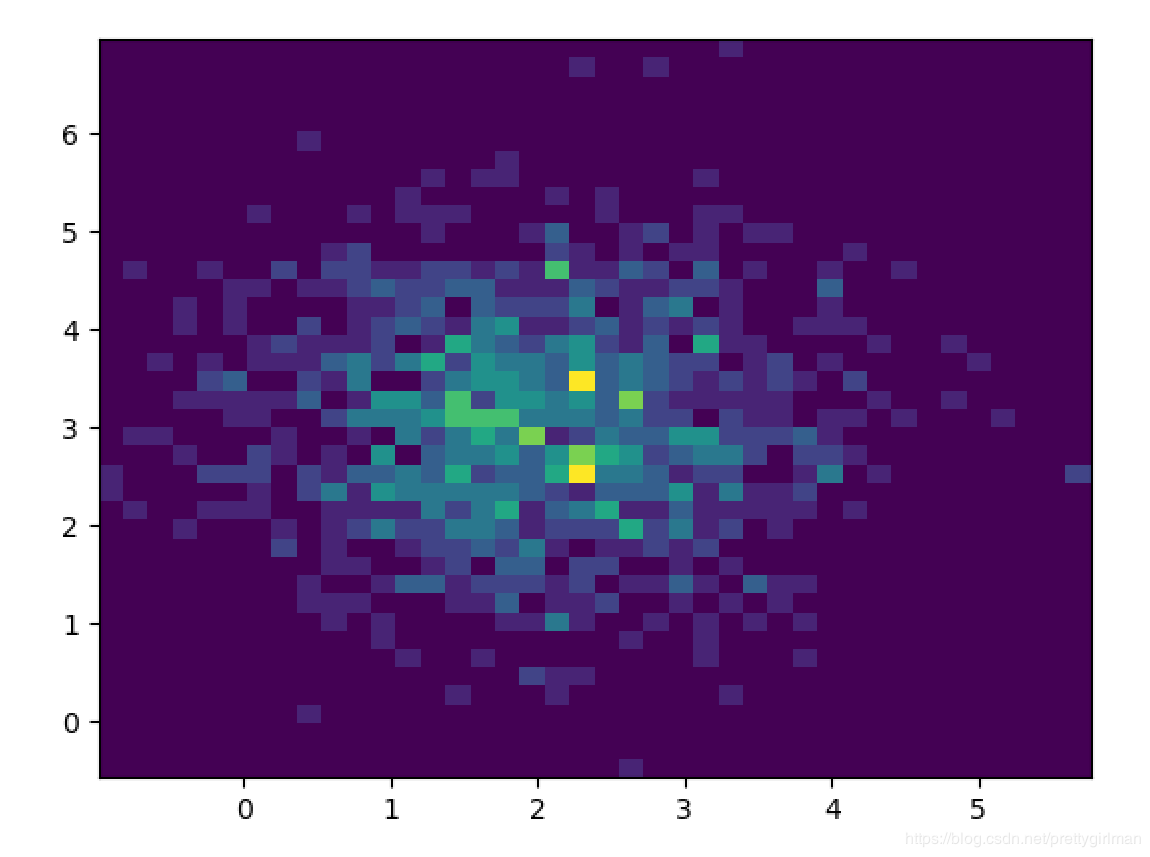
x = np.random.randn(1000)+2
y = np.random.randn(1000)+3
plt.hist2d(x, y, bins=40)
plt.show()
饼状图
import matplotlib.pyplot as plt
from matplotlib.gridspec import GridSpec
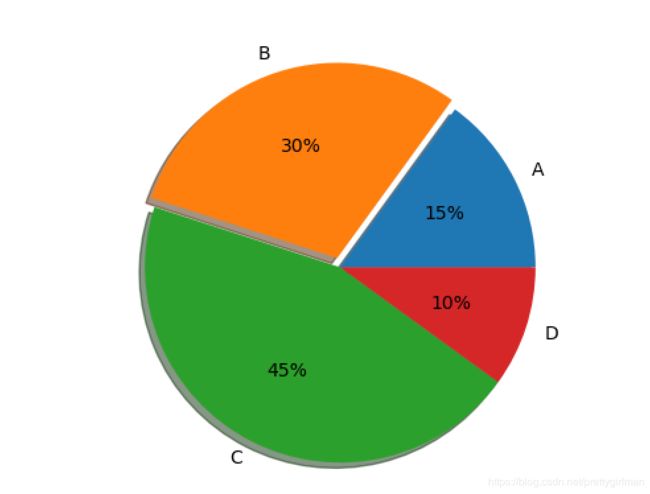
labels = 'A', 'B', 'C', 'D'
fracs = [15, 30, 45, 10]
explode = (0, 0.05, 0, 0)
plt.axes(aspect=1)
explode = (0, 0.05, 0, 0)
plt.pie(fracs, explode=explode, labels=labels, autopct='%.0f%%', shadow=True)
plt.show()
箱型图
import numpy as np
import matplotlib.pyplot as plt

np.random.seed(100)

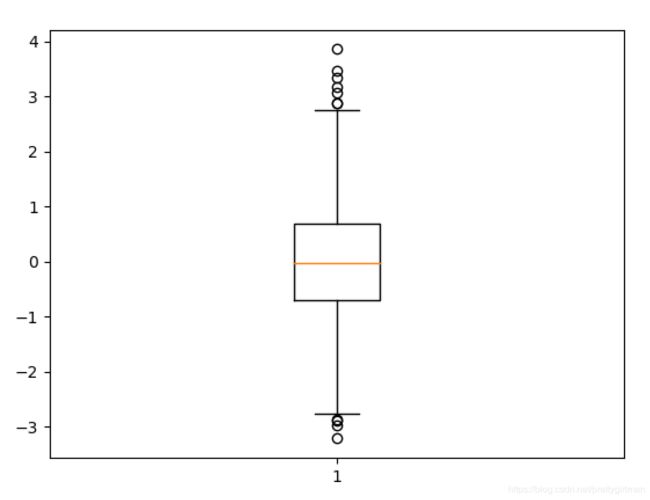
data = np.random.normal(size=1000, loc=0.0, scale=1.0)

plt.boxplot(data,sym='o',whis=1.5)

plt.show()


data = np.random.normal(size=(100, 4), loc=0.0, scale=1.0)

labels = ['A','B','C','D']

plt.boxplot(data, labels=labels)

plt.show()
颜色和样式
import numpy as np
import matplotlib.pyplot as plt
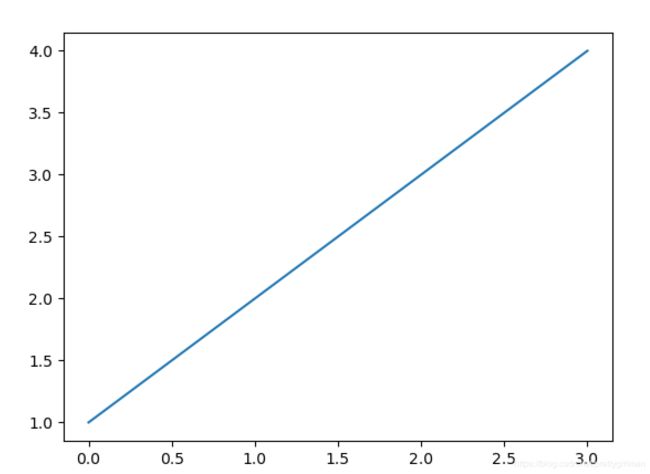
y=np.arange(1,5)
plt.plot(y)
plt.show()
y=np.arange(1,5)
plt.plot(y,'y');
plt.plot(y+1,color=(0.1,0.2,0.3));
plt.plot(y+2,'#FF00FF');
plt.plot(y+3,color='0.5')
plt.show()
'''
#线型
y=np.arange(1,5)
plt.plot(y,'--');
plt.plot(y+1,'-.');
plt.plot(y+2,':');
plt.show()
'''
'''
y=np.arange(1,5)
plt.plot(y,'o');
plt.plot(y+1,'D');
plt.plot(y+2,'^');
plt.plot(y+3,'s');
plt.plot(y+4,'p');
plt.plot(y+5,'x');
plt.show()
'''
y=np.arange(1,5)
plt.plot(y,'cx--');
plt.plot(y+1,'kp:');
plt.plot(y+2,'mo-.');
plt.show()
面向对象
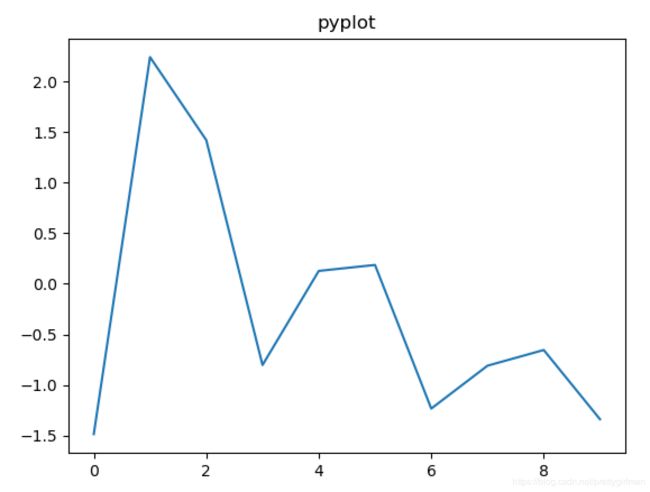
import matplotlib.pyplot as plt
import numpy as np
x=np.arange(0,10,1)
y=np.random.randn(len(x))
plt.plot(x,y)
plt.title('pyplot')
plt.show()
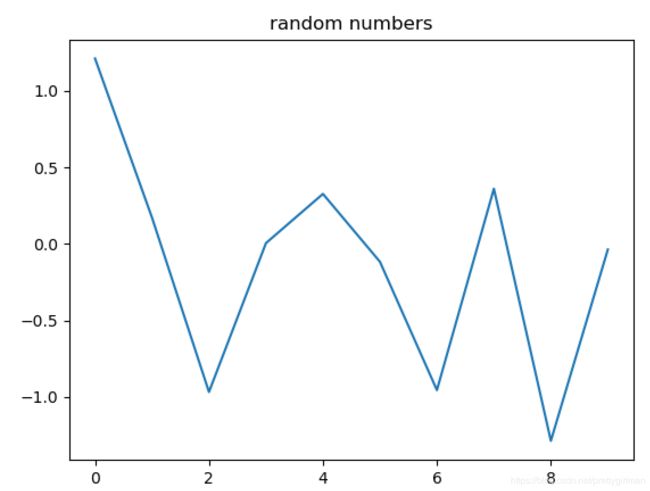
from pylab import *
x=arange(0,10,1)
y=randn(len(x))
plot(x,y)
title('random numbers')
show()
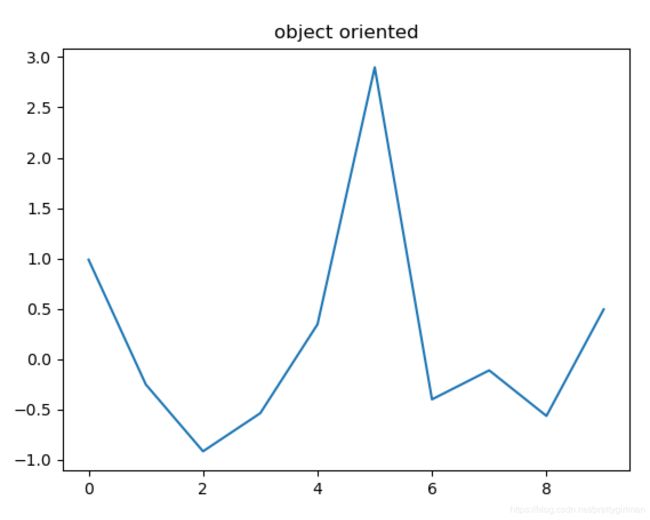
import matplotlib.pyplot as plt
import numpy as np
x=np.arange(0,10,1)
y=np.random.randn(len(x))
fig=plt.figure()
ax=fig.add_subplot(111)
l,=plt.plot(x,y)
t=ax.set_title('object oriented')
plt.show()
子图
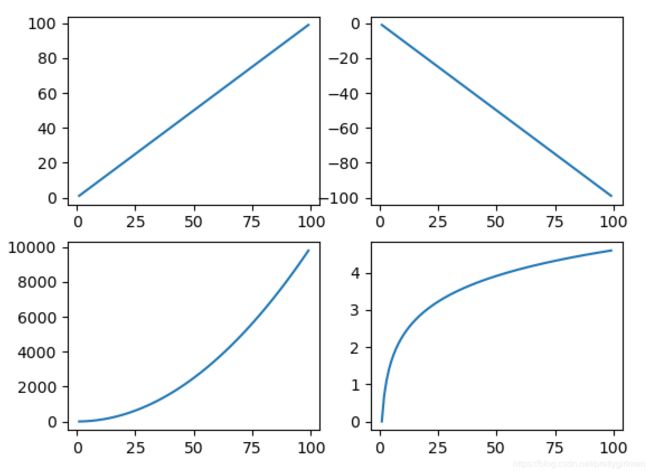
import matplotlib.pyplot as plt
import numpy as np

x=np.arange(1,100)

plt.subplot(221)
plt.plot(x,x)

plt.subplot(222)
plt.plot(x,-x)

plt.subplot(223)
plt.plot(x,x*x)

plt.subplot(224)
plt.plot(x,np.log(x))

plt.show()
多图
import matplotlib.pyplot as plt

fig1=plt.figure()

ax1=fig1.add_subplot(111)

ax1.plot([1,2,3],[3,2,1])

fig2=plt.figure()

ax2=fig2.add_subplot(111)

ax2.plot([1,2,3],[1,2,3])

plt.show()
网格
import numpy as np
import matplotlib.pyplot as plt
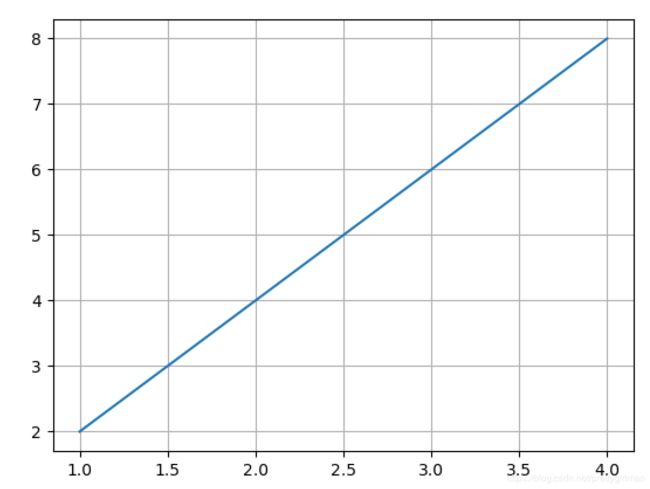
y=np.arange(1,5)
plt.plot(y,y*2)
plt.grid(True)
plt.show()
plt.grid()
import numpy as np
import matplotlib.pyplot as plt
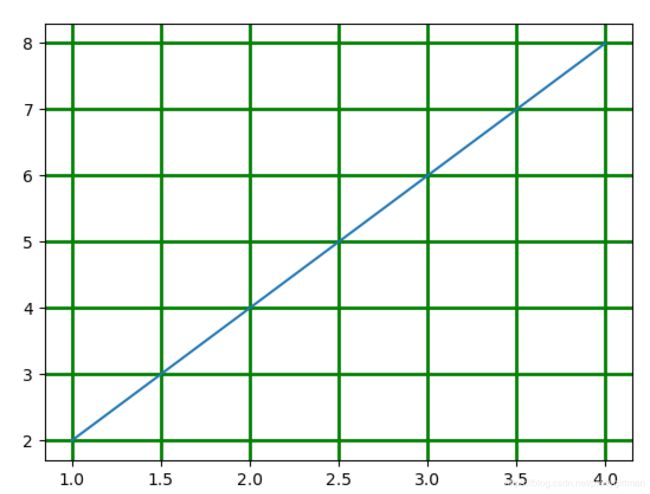
y=np.arange(1,5)
plt.plot(y,y*2)
plt.grid(True,color='g',linestyle='-',linewidth='2')
plt.show()
import matplotlib.pyplot as plt
import numpy as np
x=np.arange(0,10,1)
y=np.random.randn(len(x))
fig=plt.figure()
ax=fig.add_subplot(111)
l,=plt.plot(x,y)
ax.grid(color='g')
plt.show()
图例
import matplotlib.pyplot as plt
import numpy as np
x=np.arange(1,11,1)
y=x*x
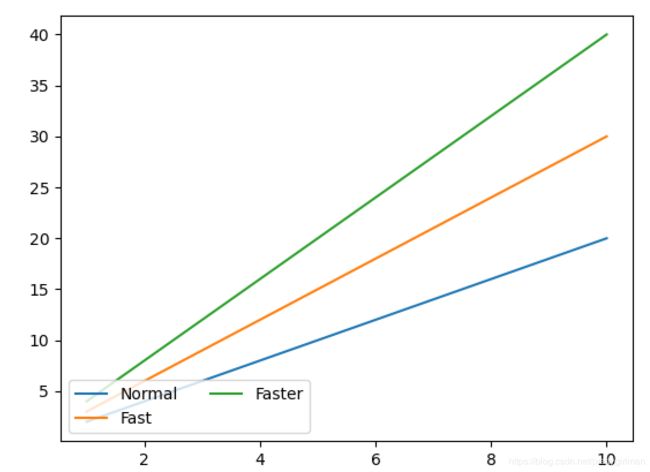
plt.plot(x,x*2,label='Normal')
plt.plot(x,x*3,label='Fast')
plt.plot(x,x*4,label='Faster')
plt.legend(loc=3,ncol=2)
plt.show()
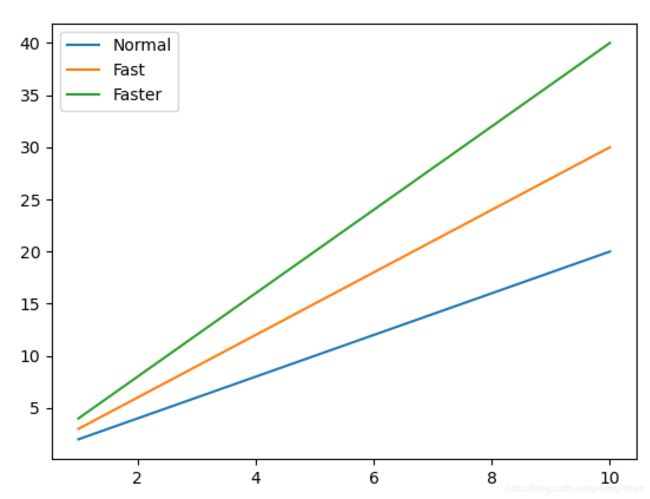
plt.plot(x,x*2)
plt.plot(x,x*3)
plt.plot(x,x*4)
plt.legend(['Normal','Fast','Faster'])
plt.show()
import matplotlib.pyplot as plt
import numpy as np
x=np.arange(0,10,1)
y=np.random.randn(len(x))
fig=plt.figure()
ax=fig.add_subplot(111)
l,=plt.plot(x,y)
ax.legend(['ax legend'])
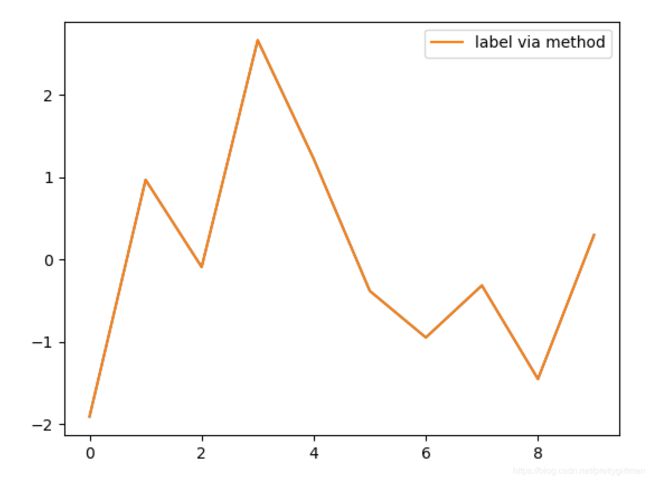
line, =ax.plot(x,y,label='Inline label')
line.set_label('label via method')
ax.legend()
plt.show()
