DESeq2差异基因分析和批次效应移除
差异基因鉴定
基因表达标准化
不同样品的测序量会有差异,最简单的标准化方式是计算
counts per million (CPM),即原始reads count除以总reads数乘以1,000,000。
这种计算方式的缺点是容易受到极高表达且在不同样品中存在差异表达的基因的影响;这些基因的打开或关闭会影响到细胞中总的分子数目,可能导致这些基因标准化之后就不存在表达差异了,而原本没有差异的基因标准化之后却有差异了。
RPKM、FPKM和TPM是CPM按照基因或转录本长度归一化后的表达,也会受到这一影响。
calc_cpm <- function (expr_mat, spikes = NULL){
  norm_factor <- colSums(expr_mat[-spikes,])
  return(t(t(expr_mat)/norm_factor)) * 10^6
}
为了解决这一问题,研究者提出了其它的标准化方法。
量化因子 (size factor,SF)是由DESeq提出的。其方法是首先计算每个基因在所有样品中表达的几何平均值。每个细胞的量化因子(size factor)是所有基因与其在所有样品中的表达值的几何平均值的比值的中位数。由于几何平均值的使用,只有在所有样品中表达都不为0的基因才能用来计算。这一方法又被称为RLE (relative log expression)。
calc_sf <- function (expr_mat, spikes=NULL){
  geomeans <- exp(rowMeans(log(expr_mat[-spikes,])))
  SF <- function(cnts){
    median((cnts/geomeans)[(is.finite(geomeans) & geomeans >0)])
  }
  norm_factor <- apply(expr_mat[-spikes,],2,SF)
  return(t(t(expr_mat)/norm_factor))
}
上四分位数 (upperquartile,UQ)是样品中所有基因的表达除以处于上四分位数的基因的表达值。同时为了保证表达水平的相对稳定,计算得到的上四分位数值要除以所有样品中上四分位数值的中位数。
calc_uq <- function (expr_mat, spikes=NULL){
  UQ <- function(x) {
    quantile(x[x>0],0.75)
  }
  uq <- unlist(apply(expr_mat[-spikes,],2,UQ))
  norm_factor <- uq/median(uq)
  return(t(t(expr_mat)/norm_factor))
}
TMM是M-值的加权截尾均值。选定一个样品为参照,其它样品中基因的表达相对于参照样品中对应基因表达倍数的log2值定义为M-值。随后去除M-值中最高和最低的30%,剩下的M值计算加权平均值。每一个非参照样品的基因表达值都乘以计算出的TMM。这个方法假设大部分基因的表达是没有差异的。
DESeq2 差异基因鉴定一步法
为了简化差异基因的运算,易生信做了脚本封装,DESeq2.sh,只需提供原始基因表达矩阵、样品分组信息表即可进行差异基因分析和鉴定。
DESeq2.sh
OPTIONS:
-f Data file [A gene count matrix, NECESSARY]
CHECK ABOVE FOR DETAILS
-s Sample file [A multiple columns file with header line,
For , one columns is needed.
NECESSARY]
CHECK ABOVE FOR DETAILS
-d The design formula for DESeqDataSetFromMatrix.
[Default ,
accept for example 2.]
-D The reduced design formula for DESeq.
[Only applicable to analysis,
accept or 具体使用
cd ~/data
# ehbio_trans.Count_matrix.xls和sampleFile都是前面用到的文件
DESeq2.sh -f ehbio_trans.Count_matrix.xls -s sampleFile

[1] "Perform pairwise comparasion using "
estimating size factors
estimating dispersions
gene-wise dispersion estimates
mean-dispersion relationship
final dispersion estimates
fitting model and testing
[1] "Output normalized counts"
[1] "Output rlog transformed normalized counts"
[1] "Performing sample clustering"
null device
          1
[1] "DE genes between untrt trt"
[1] "PCA analysis"
null device
运行结束即可获得以下结果文件
# 具体的文件内容和图的样式见后面的分步法文档
# 原始输入文件
ehbio_trans.Count_matrix.xls
sampleFile

# 所有差异基因列表
ehbio_trans.Count_matrix.xls.DESeq2.all.DE

# PCA结果
ehbio_trans.Count_matrix.xls.DESeq2.normalized.rlog.pca.pdf

# 样品相关性层级聚类结果
ehbio_trans.Count_matrix.xls.DESeq2.normalized.rlog.pearson.pdf

# rlog转换后的标准化后的表达结果
ehbio_trans.Count_matrix.xls.DESeq2.normalized.rlog.xls

# 标准化后的表达结果
ehbio_trans.Count_matrix.xls.DESeq2.normalized.xls

# 运行脚本
ehbio_trans.Count_matrix.xls.DESeq2.r

# 差异基因结果
ehbio_trans.Count_matrix.xls.DESeq2.untrt._higherThan_.trt.id.xls
ehbio_trans.Count_matrix.xls.DESeq2.untrt._higherThan_.trt.xls
ehbio_trans.Count_matrix.xls.DESeq2.untrt._lowerThan_.trt.id.xls
ehbio_trans.Count_matrix.xls.DESeq2.untrt._lowerThan_.trt.xls

# 火山图和火山图输入数据
ehbio_trans.Count_matrix.xls.DESeq2.untrt._vs_.trt.results.xls
ehbio_trans.Count_matrix.xls.DESeq2.untrt._vs_.trt.results.xls.volcano.pdf
一步法脚本可在https://ke.qq.com/course/301387?tuin=20cd7788或点击阅读原文获得。
DESeq2 差异基因鉴定分步法
安装包 DESeq2安装方法如下
source("https://bioconductor.org/biocLite.R")
biocLite('BiocInstaller')
biocLite("DESeq2")
install.packages(c("gplots", "amap", "ggplot2"))
A distributional assumption is needed because we want to estimate the
probability of extreme events (large fold change just appearing by
chance) from limited replicates. The negative binomial (a.k.a.
Gamma-Poisson) is a good choice for RNA-seq experiments because
- The observed data at gene level is inherently counts or estimated
counts of fragments for each feature and - The spread of values among biological replicates is more than given
by a simpler, one parameter distribution, the Poisson; and it seems
to be captured by the NB sufficiently well
加载包
library(DESeq2)

## Loading required package: S4Vectors

## Loading required package: stats4

## Loading required package: BiocGenerics

## Loading required package: parallel

##
## Attaching package: 'BiocGenerics'

## The following objects are masked from 'package:parallel':
##
##     clusterApply, clusterApplyLB, clusterCall, clusterEvalQ,
##     clusterExport, clusterMap, parApply, parCapply, parLapply,
##     parLapplyLB, parRapply, parSapply, parSapplyLB

## The following objects are masked from 'package:stats':
##
##     IQR, mad, sd, var, xtabs

## The following objects are masked from 'package:base':
##
##     anyDuplicated, append, as.data.frame, cbind, colMeans,
##     colnames, colSums, do.call, duplicated, eval, evalq, Filter,
##     Find, get, grep, grepl, intersect, is.unsorted, lapply,
##     lengths, Map, mapply, match, mget, order, paste, pmax,
##     pmax.int, pmin, pmin.int, Position, rank, rbind, Reduce,
##     rowMeans, rownames, rowSums, sapply, setdiff, sort, table,
##     tapply, union, unique, unsplit, which, which.max, which.min

##
## Attaching package: 'S4Vectors'

## The following object is masked from 'package:base':
##
##     expand.grid

## Loading required package: IRanges

## Loading required package: GenomicRanges

## Loading required package: GenomeInfoDb

## Loading required package: SummarizedExperiment

## Loading required package: Biobase

## Welcome to Bioconductor
##
##     Vignettes contain introductory material; view with
##     'browseVignettes()'. To cite Bioconductor, see
##     'citation("Biobase")', and for packages 'citation("pkgname")'.

## Loading required package: DelayedArray

## Loading required package: matrixStats

##
## Attaching package: 'matrixStats'

## The following objects are masked from 'package:Biobase':
##
##     anyMissing, rowMedians

##
## Attaching package: 'DelayedArray'

## The following objects are masked from 'package:matrixStats':
##
##     colMaxs, colMins, colRanges, rowMaxs, rowMins, rowRanges

## The following object is masked from 'package:base':
##
##     apply

library("RColorBrewer")
library("gplots")

##
## Attaching package: 'gplots'

## The following object is masked from 'package:IRanges':
##
##     space

## The following object is masked from 'package:S4Vectors':
##
##     space

## The following object is masked from 'package:stats':
##
##     lowess

library("amap")
library("ggplot2")
library("BiocParallel")

# 多线程加速, 使用4个核
# 如果你电脑性能强大,可以把这个数变大
register(MulticoreParam(4))
读入数据
# 注意文件的位置,程序自己不知道文件在什么地方
# 如果只给文件名,不给路径,程序只会在当前目录查找文件
# 若找不到,则会报错
# 可以使用下面命令设置工作目录到文件所在目录
# 或提供文件全路径
# setwd("~/data")
data <- read.table("ehbio_trans.Count_matrix.xls", header=T, row.names=1, com='', quote='',
    check.names=F, sep="\t")

# 撇掉在多于两个样本中count<1的值,如果样本数多,这个数值可以适当增加
# 排除极低表达基因的干扰
data <- data[rowSums(data)>2,]
head(data)

##                 untrt_N61311 untrt_N052611 untrt_N080611 untrt_N061011
## ENSG00000227232           13            25            23            24
## ENSG00000278267            0             5             3             4
## ENSG00000268903            0             2             0             0
## ENSG00000269981            0             3             0             1
## ENSG00000241860            3            11             1             5
## ENSG00000279457           46            90            73            49
##                 trt_N61311 trt_N052611 trt_N080611 trt_N061011
## ENSG00000227232         12          12          22          22
## ENSG00000278267          2           4           3           1
## ENSG00000268903          0           2           0           3
## ENSG00000269981          0           2           0           0
## ENSG00000241860          3           2           0           2
## ENSG00000279457         52          46          89          31

# 读入分组信息
sample <- read.table("sampleFile", header=T, row.names=1, com='',
    quote='', check.names=F, sep="\t", colClasses="factor")

sample <- sample[match(colnames(data), rownames(sample)),, drop=F]
sample_rowname <- rownames(sample)

# 下面的可以忽略,如果没遇到错误不需要执行
# 目的是做因子转换
sample <- data.frame(lapply(sample, function(x) factor(x, levels=unique(x))))
rownames(sample) <- sample_rowname
sample

##               conditions
## untrt_N61311       untrt
## untrt_N052611      untrt
## untrt_N080611      untrt
## untrt_N061011      untrt
## trt_N61311           trt
## trt_N052611          trt
## trt_N080611          trt
## trt_N061011          trt
产生DESeq数据集
DESeq2包采用DESeqDataSet存储原始的read count和中间计算的统计量。
每个DESeqDataSet对象都要有一个实验设计formula,用于对数据进行分组,以便计算表达值的离散度和估计表达倍数差异,通常格式为~ batch + conditions
(为了方便后续计算,最为关注的分组信息放在最后一位)。
countData: 表达矩阵
colData: 样品分组信息表
design: 实验设计信息,conditions必须是colData中的一列
ddsFullCountTable <- DESeqDataSetFromMatrix(countData = data,
        colData = sample,  design= ~ conditions)

dds <- DESeq(ddsFullCountTable)

## estimating size factors

## estimating dispersions

## gene-wise dispersion estimates

## mean-dispersion relationship

## final dispersion estimates

## fitting model and testing
获取标准化后的数据
# ?counts查看此函数功能
# normalized=T, 返回标准化的数据
normalized_counts <- counts(dds, normalized=TRUE)
head(normalized_counts)

##                 untrt_N61311 untrt_N052611 untrt_N080611 untrt_N061011
## ENSG00000227232    12.730963     21.179286    19.4979982     25.994727
## ENSG00000278267     0.000000      4.235857     2.5432172      4.332454
## ENSG00000268903     0.000000      1.694343     0.0000000      0.000000
## ENSG00000269981     0.000000      2.541514     0.0000000      1.083114
## ENSG00000241860     2.937915      9.318886     0.8477391      5.415568
## ENSG00000279457    45.048024     76.245430    61.8849507     53.072567
##                 trt_N61311 trt_N052611 trt_N080611 trt_N061011
## ENSG00000227232  13.423907   17.885811   15.750664   23.250144
## ENSG00000278267   2.237318    5.961937    2.147818    1.056825
## ENSG00000268903   0.000000    2.980969    0.000000    3.170474
## ENSG00000269981   0.000000    2.980969    0.000000    0.000000
## ENSG00000241860   3.355977    2.980969    0.000000    2.113649
## ENSG00000279457  58.170264   68.562276   63.718596   32.761567
根据基因在不同的样本中表达变化的差异程度mad值对数据排序,差异越大的基因排位越前。
normalized_counts_mad <- apply(normalized_counts, 1, mad)
normalized_counts <- normalized_counts[order(normalized_counts_mad, decreasing=T), ]

# 标准化后的数据输出
write.table(normalized_counts, file="ehbio_trans.Count_matrix.xls.DESeq2.normalized.xls",
quote=F, sep="\t", row.names=T, col.names=T)

# 只在Linux下能运行,目的是填补表格左上角内容
system(paste("sed -i '1 s/^/ID\t/'", "ehbio_trans.Count_matrix.xls.DESeq2.normalized.xls"))

# log转换后的结果
rld <- rlog(dds, blind=FALSE)
rlogMat <- assay(rld)
rlogMat <- rlogMat[order(normalized_counts_mad, decreasing=T), ]


write.table(rlogMat, file="ehbio_trans.Count_matrix.xls.DESeq2.normalized.rlog.xls",
quote=F, sep="\t", row.names=T, col.names=T)

# 只在Linux下能运行,目的是填补表格左上角内容
system(paste("sed -i '1 s/^/ID\t/'", "ehbio_trans.Count_matrix.xls.DESeq2.normalized.rlog.xls"))
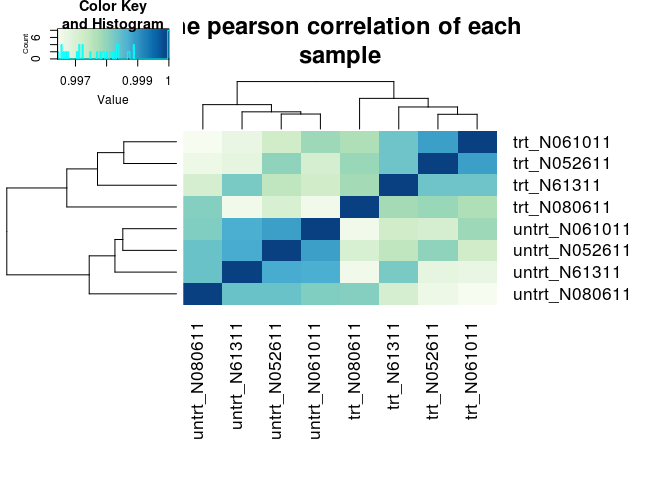
样品层级聚类分析,判断样品的相似性和组间组内差异
# 生成颜色
hmcol <- colorRampPalette(brewer.pal(9, "GnBu"))(100)

# 计算相关性pearson correlation
pearson_cor <- as.matrix(cor(rlogMat, method="pearson"))

# 层级聚类
hc <- hcluster(t(rlogMat), method="pearson")

# 热图绘制
## 在命令行下运行时,需要去除下面开头的#号,把输出的图保存到文件中
## 输出到文件时,dev.off()命令是关闭输出,从而完成图片的写入。如果不做这一步,则图片则不能写入,从而不能打开
## 如果在Rstudio或其它可视化界面时,可以直接把图输出到屏幕
#pdf("ehbio_trans.Count_matrix.xls.DESeq2.normalized.rlog.pearson.pdf", pointsize=10)
heatmap.2(pearson_cor, Rowv=as.dendrogram(hc), symm=T, trace="none",
col=hmcol, margins=c(11,11), main="The pearson correlation of each
sample")
#dev.off()
样品PCA分析
pca_data <- plotPCA(rld, intgroup=c("conditions"), returnData=T, ntop=5000)
差异基因分析
# 定义变量的好处是下面的代码就独立了
# 如果想比较不同的组,只需在这修改即可,后面代码都可以不动
sampleA = "untrt"
sampleB = "trt"
results函数提取差异基因分析结果,包含log2 fold changes,
p values和adjusted p values.
constrast用于指定比较的两组的信息,输出的log2FoldChange为log2(SampleA/SampleB)。
contrastV <- c("conditions", sampleA, sampleB)
res <- results(dds,  contrast=contrastV)
res

## log2 fold change (MLE): conditions untrt vs trt
## Wald test p-value: conditions untrt vs trt
## DataFrame with 26280 rows and 6 columns
##                   baseMean log2FoldChange     lfcSE        stat    pvalue
##
## ENSG00000227232 18.7141876     0.17695376 0.3809406  0.46451794 0.6422767
## ENSG00000278267  2.8144283     0.02802497 1.0249422  0.02734297 0.9781862
## ENSG00000268903  0.9807232    -1.71669654 2.3186888 -0.74037385 0.4590732
## ENSG00000269981  0.8256996     0.59077960 2.4538911  0.24075217 0.8097472
## ENSG00000241860  3.3713378     1.21773503 1.0789466  1.12863330 0.2590526
## ...                    ...            ...       ...         ...       ...
## 29256            0.3507226      1.8471273  3.484683  0.53007036 0.5960631
## 36308            0.9279831      0.1394489  1.598343  0.08724589 0.9304761
## 8414             0.7459738     -0.2678522  2.053434 -0.13044109 0.8962175
## 28837            1.2626343      0.2689443  1.405958  0.19128899 0.8482992
## 35320            1.0041030      0.5493562  1.717832  0.31979625 0.7491228
##                      padj
##
## ENSG00000227232 0.8538515
## ENSG00000278267        NA
## ENSG00000268903        NA
## ENSG00000269981        NA
## ENSG00000241860        NA
## ...                   ...
## 29256                  NA
## 36308                  NA
## 8414                   NA
## 28837                  NA
## 35320                  NA
给DESeq2的原始输出结果增加样品平均表达信息,使得结果更容易理解和解析。
# 获得第一组数据均值
baseA <- counts(dds, normalized=TRUE)[, colData(dds)$conditions == sampleA]

if (is.vector(baseA)){
    baseMeanA <- as.data.frame(baseA)
} else {
    baseMeanA <- as.data.frame(rowMeans(baseA))
}
colnames(baseMeanA) <- sampleA
head(baseMeanA)

##                      untrt
## ENSG00000227232 19.8507436
## ENSG00000278267  2.7778822
## ENSG00000268903  0.4235857
## ENSG00000269981  0.9061570
## ENSG00000241860  4.6300269
## ENSG00000279457 59.0627429

# 获得第二组数据均值
baseB <- counts(dds, normalized=TRUE)[, colData(dds)$conditions == sampleB]
if (is.vector(baseB)){
        baseMeanB <- as.data.frame(baseB)
} else {
        baseMeanB <- as.data.frame(rowMeans(baseB))
}
colnames(baseMeanB) <- sampleB
head(baseMeanB)

##                        trt
## ENSG00000227232 17.5776316
## ENSG00000278267  2.8509744
## ENSG00000268903  1.5378607
## ENSG00000269981  0.7452421
## ENSG00000241860  2.1126487
## ENSG00000279457 55.8031756

# 结果组合
res <- cbind(baseMeanA, baseMeanB, as.data.frame(res))
head(res)

##                      untrt        trt   baseMean log2FoldChange     lfcSE
## ENSG00000227232 19.8507436 17.5776316 18.7141876     0.17695376 0.3809406
## ENSG00000278267  2.7778822  2.8509744  2.8144283     0.02802497 1.0249422
## ENSG00000268903  0.4235857  1.5378607  0.9807232    -1.71669654 2.3186888
## ENSG00000269981  0.9061570  0.7452421  0.8256996     0.59077960 2.4538911
## ENSG00000241860  4.6300269  2.1126487  3.3713378     1.21773503 1.0789466
## ENSG00000279457 59.0627429 55.8031756 57.4329592     0.08926886 0.2929300
##                        stat    pvalue      padj
## ENSG00000227232  0.46451794 0.6422767 0.8538515
## ENSG00000278267  0.02734297 0.9781862        NA
## ENSG00000268903 -0.74037385 0.4590732        NA
## ENSG00000269981  0.24075217 0.8097472        NA
## ENSG00000241860  1.12863330 0.2590526        NA
## ENSG00000279457  0.30474470 0.7605606 0.9130580

# 增加ID信息
res <- cbind(ID=rownames(res), as.data.frame(res))
res$baseMean <- rowMeans(cbind(baseA, baseB))

# 校正后p-value为NA的复制为1
res$padj[is.na(res$padj)] <- 1

# 按pvalue排序, 把差异大的基因放前面
res <- res[order(res$pvalue),]
head(res)

##                              ID     untrt       trt   baseMean
## ENSG00000152583 ENSG00000152583   77.8512  1900.412   989.1314
## ENSG00000148175 ENSG00000148175 7233.0010 19483.552 13358.2766
## ENSG00000179094 ENSG00000179094  151.7491  1380.881   766.3151
## ENSG00000134686 ENSG00000134686 1554.0390  4082.440  2818.2395
## ENSG00000125148 ENSG00000125148 1298.0392  5958.946  3628.4926
## ENSG00000120129 ENSG00000120129  773.9769  5975.522  3374.7494
##                 log2FoldChange      lfcSE      stat        pvalue
## ENSG00000152583      -4.608311 0.21090819 -21.84984 7.800059e-106
## ENSG00000148175      -1.429585 0.08639329 -16.54741  1.671380e-61
## ENSG00000179094      -3.184674 0.20065896 -15.87108  1.005030e-56
## ENSG00000134686      -1.392749 0.09190323 -15.15451  7.073605e-52
## ENSG00000125148      -2.199191 0.14796048 -14.86337  5.698869e-50
## ENSG00000120129      -2.948122 0.19931242 -14.79146  1.663007e-49
##                          padj
## ENSG00000152583 1.331002e-101
## ENSG00000148175  1.426021e-57
## ENSG00000179094  5.716612e-53
## ENSG00000134686  3.017600e-48
## ENSG00000125148  1.944910e-46
## ENSG00000120129  4.729591e-46
整体分析结果输出到文件
comp314 <- paste(sampleA, "_vs_", sampleB, sep=".")

# 生成文件名
file_base <- paste("ehbio_trans.Count_matrix.xls.DESeq2", comp314, sep=".")
file_base1 <- paste(file_base, "results.xls", sep=".")
write.table(as.data.frame(res), file=file_base1, sep="\t", quote=F, row.names=F)
提取差异表达基因
# 差异基因筛选,padj<0.1
res_de <- subset(res, res$padj<0.1, select=c('ID', sampleA,
        sampleB, 'log2FoldChange', 'padj'))
# foldchang > 1
res_de_up <- subset(res_de, res_de$log2FoldChange>=1)

file <- paste("ehbio_trans.Count_matrix.xls.DESeq2",sampleA,"_higherThan_",sampleB,
        'xls', sep=".")
write.table(as.data.frame(res_de_up), file=file, sep="\t", quote=F, row.names=F)

res_de_dw <- subset(res_de, res_de$log2FoldChange<=(-1)*1)

file <- paste("ehbio_trans.Count_matrix.xls.DESeq2",sampleA, "_lowerThan_", sampleB,
        'xls', sep=".")
write.table(as.data.frame(res_de_dw), file=file, sep="\t", quote=F, row.names=F)

# 差异基因ID
res_de_up_id = data.frame(ID=res_de_up$ID,
        type=paste(sampleA,"_higherThan_", sampleB, sep="."))
res_de_dw_id = data.frame(ID=res_de_dw$ID,
        type=paste(sampleA,"_lowerThan_", sampleB, sep="."))
de_id = rbind(res_de_up_id, res_de_dw_id)

file <- "ehbio_trans.Count_matrix.xls.DESeq2.all.DE"
write.table(as.data.frame(de_id), file=file, sep="\t", quote=F, row.names=F, col.names=F)
绘制火山图
# 可以把前面生成的results.xls文件提交到www.ehbio.com/ImageGP绘制火山图
# 或者使用我们的s-plot https://github.com/Tong-Chen/s-plot
logCounts <- log2(res$baseMean+1)
logFC <- res$log2FoldChange
FDR <- res$padj
#png(filename=paste(file_base, "Volcano.png", sep="."))
plot(logFC, -1*log10(FDR), col=ifelse(FDR<=0.01, "red", "black"),
 xlab="logFC", ylab="-1*log1o(FDR)", main="Volcano plot", pch=".")
#dev.off()
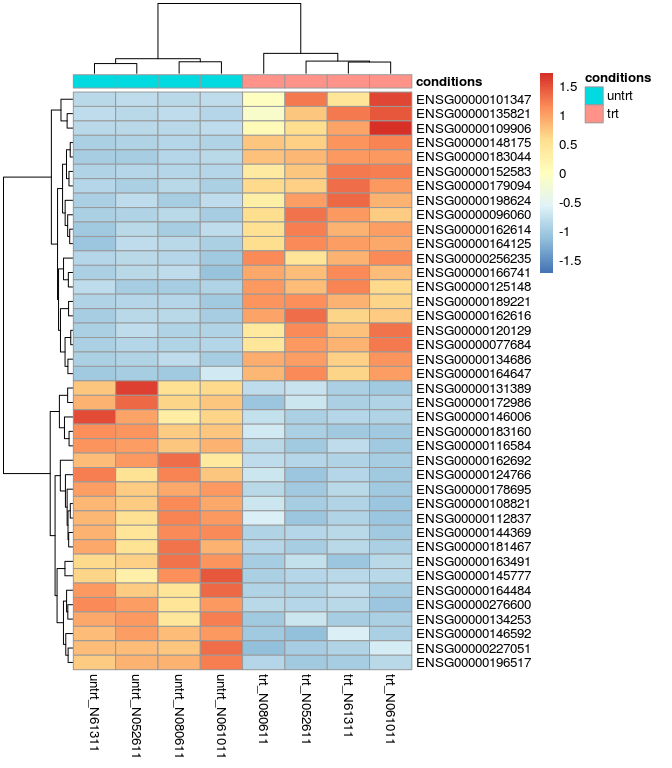
差异基因热图
res_de_up_top20_id <- as.vector(head(res_de_up$ID,20))
res_de_dw_top20_id <- as.vector(head(res_de_dw$ID,20))

red_de_top20 <- c(res_de_up_top20_id, res_de_dw_top20_id)
red_de_top20

##  [1] "ENSG00000178695" "ENSG00000196517" "ENSG00000116584"
##  [4] "ENSG00000144369" "ENSG00000276600" "ENSG00000108821"
##  [7] "ENSG00000162692" "ENSG00000181467" "ENSG00000145777"
## [10] "ENSG00000163491" "ENSG00000183160" "ENSG00000172986"
## [13] "ENSG00000164484" "ENSG00000131389" "ENSG00000134253"
## [16] "ENSG00000124766" "ENSG00000227051" "ENSG00000146006"
## [19] "ENSG00000112837" "ENSG00000146592" "ENSG00000152583"
## [22] "ENSG00000148175" "ENSG00000179094" "ENSG00000134686"
## [25] "ENSG00000125148" "ENSG00000120129" "ENSG00000189221"
## [28] "ENSG00000109906" "ENSG00000101347" "ENSG00000162614"
## [31] "ENSG00000096060" "ENSG00000162616" "ENSG00000166741"
## [34] "ENSG00000183044" "ENSG00000164125" "ENSG00000198624"
## [37] "ENSG00000256235" "ENSG00000077684" "ENSG00000135821"
## [40] "ENSG00000164647"

# 可以把矩阵存储,提交到www.ehbio.com/ImageGP绘制火山图
# 或者使用我们的s-plot https://github.com/Tong-Chen/s-plot
red_de_top20_expr <- normalized_counts[rownames(normalized_counts) %in% red_de_top20,]
library(pheatmap)
pheatmap(red_de_top20_expr, cluster_row=T, scale="row", annotation_col=sample)
关于批次效应
见论坛讨论 http://www.ehbio.com/Esx/d/10-deseq2。
每个DESeqDataSet对象都要有一个实验设计formula,用于对数据进行分组,以便计算表达值的离散度和估计表达倍数差异,通常格式为~ batch + conditions
(为了方便后续计算,最为关注的分组信息放在最后一位)。
如果记录了样本的批次信息,或者其它需要抹除的信息可以定义在design参数中,在下游回归的分析中会根据design formula来估计batch effect的影响,并在下游分析时减去这个影响。这是处理batch effect的推荐方式。
在模型中考虑batch effect并没有在数据矩阵中移除bacth effect,如果下游处理时,确实有需要可以使用limma包的removeBatchEffect来处理。
countData: 表达矩阵
colData: 样品分组信息表
design: 实验设计信息,batch和conditions必须是colData中的一列
ddsFullCountTable <- DESeqDataSetFromMatrix(countData = data,
        colData = sample,  design= ~ batch + conditions)

dds <- DESeq(ddsFullCountTable)

rld <- rlog(dds, blind=FALSE)
rlogMat <- assay(rld)
rlogMat <- limma::removeBatchEffect(rlogMat, c(sample$batch))
Just to be clear, there’s an important difference between removing a
batch effect and modelling a batch effect. Including the batch in your
design formula will model the batch effect in the regression step, which
means that the raw data are not modified (so the batch effect is not
removed), but instead the regression will estimate the size of the batch
effect and subtract it out when performing all other tests. In addition,
the model’s residual degrees of freedom will be reduced appropriately to
reflect the fact that some degrees of freedom were “spent” modelling the
batch effects. This is the preferred approach for any method that is
capable of using it (this includes DESeq2). You would only remove the
batch effect (e.g. using limma’s removeBatchEffect function) if you were
going to do some kind of downstream analysis that can’t model the batch
effects, such as training a classifier.
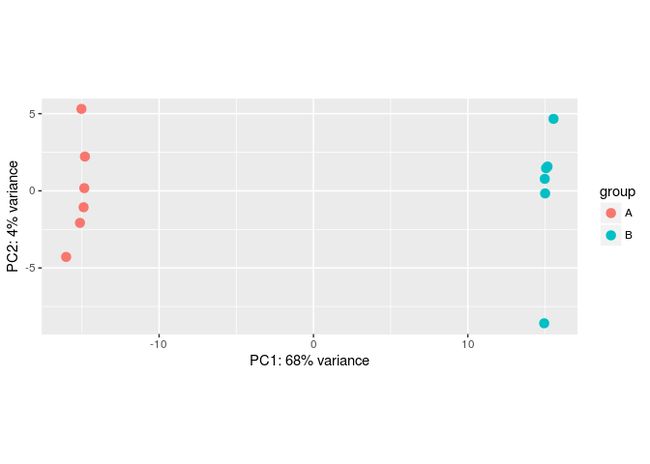
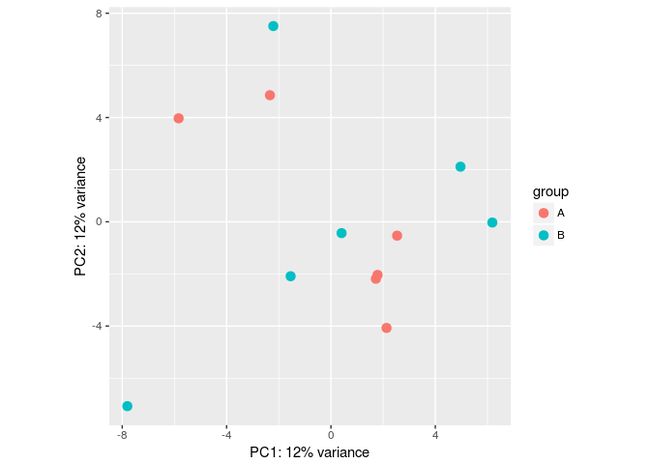
批次效应模拟
#Make some simulated data with a batch effect:
dds <- makeExampleDESeqDataSet(betaSD=1,interceptMean=10)
dds$batch <- factor(rep(c("A","B"),each=6))

#VST, remove batch effect, then plotPCA:

vsd <- vst(dds)
plotPCA(vsd, "batch")
assay(vsd) <- limma::removeBatchEffect(assay(vsd), vsd$batch)
plotPCA(vsd, "batch")
SVA(批次未记录时,寻找潜在影响因子,并矫正)
dat <- counts(dds, normalized=TRUE)
idx <- rowMeans(dat) > 1
dat <- dat[idx,]
mod <- model.matrix(~ dex, colData(dds))
mod0 <- model.matrix(~ 1, colData(dds))
##calculating the variables
n.sv <- num.sv(dat,mod,method="leek") #gives 11
### using 4
lnj.corr <- svaBatchCor(dat,mod,mod0,n.sv=4)
co <- lnj.corr$corrected
plPCA(co)
#http://www.bioconductor.org/packages/release/bioc/vignettes/sva/inst/doc/sva.pdf
#http://bioconductor.org/help/workflows/rnaseqGene/#removing-hidden-batch-effects
参考资料
- https://bioconductor.org/packages/release/bioc/vignettes/DESeq2/inst/doc/DESeq2.html
- http://dx.doi.org/10.1186/s13059-014-0550-8


